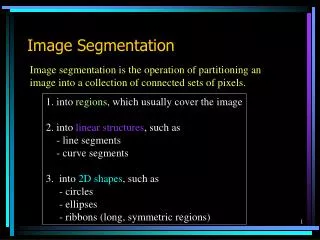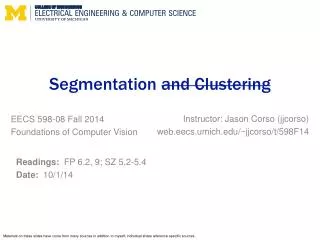
Understanding Cluster Analysis: Techniques, Applications, and Challenges in Data Analytics
Cluster analysis is a statistical method used to group data so that elements in the same group are similar, while those in different groups are distinct. This technique helps identify patterns and relationships within data, maximizing distances between clusters while minimizing distances within. The K-means algorithm, a popular clustering method, assigns data points to clusters based on initial centroids. Although effective, challenges such as choosing the right number of clusters and evaluating cohesion can arise. Understanding these fundamentals is crucial for meaningful data segmentation.

Understanding Cluster Analysis: Techniques, Applications, and Challenges in Data Analytics
E N D
Presentation Transcript
What is Cluster Analysis? Grouping data so that elements in a group will be • Similar (or related) to one another • Different (or unrelated) from elements in other groups Distance within clusters is minimized Distance between clusters is maximized http://www.baseball.bornbybits.com/blog/uploaded_images/Takashi_Saito-703616.gif
(Partitional) Clustering Three distinct groups emerge, but… …some curveballs behave more like splitters. …some splitters look more like fastballs.
Clusters can be ambiguous 6 How many clusters? 2 4 The difference is the threshold you set. How distinct must a cluster be to be it’s own cluster? adapted from Tan, Steinbach, and Kumar. Introduction to Data Mining (2004)
K-means (partitional) Choose K clusters The K-means algorithm is one method for doing partitional clustering Select K points as initial centroids Assign all points to clusters based on distance Recompute the centroid of each cluster Yes No DONE! Did the center change?
K-Means Demonstration Here is the initial data set
K-Means Demonstration Choose K points as initial centroids
K-Means Demonstration Assign data points according to distance
K-Means Demonstration Recalculate the centroids
K-Means Demonstration And re-assign the points
K-Means Demonstration And keep doing that until you settle on a final set of clusters
Example of Poor Initialization This may “work” mathematically but the clusters don’t make much sense.
Evaluating K-Means Clusters • On the previous slides, we did it visually, but there is a mathematical test • Sum-of-Squares Error (SSE) • The distance to the nearest cluster center • How close does each point get to the center? • This just means • In a cluster, compute distance from a point (m) to the cluster center (x) • Square that distance (so sign isn’t an issue) • Add them all together
Example: Evaluating Clusters Cluster 1 Cluster 2 3 3.3 1 1.3 1.5 2 SSE2 = 32 + 3.32 + 1.52 = 9 + 10.89 + 2.25 = 22.14 SSE1 = 12 + 1.32 + 22 = 1 + 1.69 + 4 = 6.69 Reducing SSE within a cluster increases cohesion (we want that)
Pre-processing: Getting the right centroids • Normalize the data • Reduces dispersion and influence of outliers • Adjusts for differences in scale(income in dollars versus age in years) • Remove outliers altogether • Also reduces dispersion that can skew the cluster centroids • They don’t represent the population anyway There’s no single, best way to choose initial centroids
Limitations of K-Means Clustering The clusters may nevermake sense. In that case, the data may just not be well-suited for clustering!
Similarity between clusters (inter-cluster) • Most common: distance between centroids • Also can use SSE • Look at distance between cluster 1’s points and other centroids • You’d want to maximize SSE between clusters Increasing SSE across clusters increases separation (we want that) Cluster 1 Cluster 5
Figuring out if our clusters are good • “Good” means • Meaningful • Useful • Provides insight • The pitfalls • Poor clusters reveal incorrect associations • Poor clusters reveal inconclusive associations • There might be room for improvement and we can’t tell • This is somewhat subjective and depends upon the expectations of the analyst
The Keys to Successful Clustering In SAS, cohesion is measured by root mean square standard deviation… • We want high cohesion within clusters (minimize differences) • Low SSE, high correlation • And high separation between clusters (maximize differences) • High SSE, low correlation • Choose the right number of clusters • Choose the right initial centroids • No easy way to do this • Trial-and-error, knowledge of the problem, and looking at the output …and separation measured by distance to nearest cluster