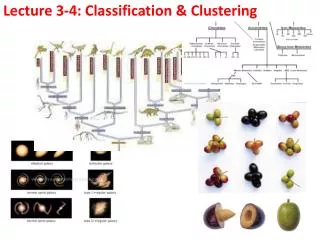
BINF636 Clustering and Classification
BINF636 Clustering and Classification. Jeff Solka Ph.D. Fall 2008. Gene Expression Data. samples. Genes. x gi = expression for gene g in sample i. The Pervasive Notion of Distance.

BINF636 Clustering and Classification
E N D
Presentation Transcript
BINF636Clustering and Classification Jeff Solka Ph.D. Fall 2008 BINF636 CLUSTERING AND CLASSIFICATION
Gene Expression Data samples Genes xgi = expression for gene g in sample i BINF636 CLUSTERING AND CLASSIFICATION
The Pervasive Notion of Distance • We have to be able to measure similarity or dissimilarity in order to perform clustering, dimensionality reduction, visualization, and discriminant analysis. • How we measure distance can have a profound effect on the performance of these algorithms. BINF636 CLUSTERING AND CLASSIFICATION
Distance Measures and Clustering • Most of the common clustering methods such as k-means, partitioning around medoid (PAM) and hierarchical clustering are dependent on the calculation of distance or an interpoint distance matrix. • Some clustering methods such as those based on spectral decomposition have a less clear dependence on the distance measure. BINF636 CLUSTERING AND CLASSIFICATION
Distance Measures and Discriminant Analysis • Many supervised learning procedures (a.k.a. discriminant analysis procedures) also depend on the concept of a distance. • nearest neighbors • k-nearest neighbors • Mixture-models BINF636 CLUSTERING AND CLASSIFICATION
Two Main Classes of Distances • Consider two gene expression profiles as expressed across I samples. Each of these can be considered as points in RI space. We can calculate the distance between these two points. • Alternatively we can view the gene expression profiles as being manifestations of samples from two different probability distributions. BINF636 CLUSTERING AND CLASSIFICATION
A General Framework for Distances Between Points • Consider two m-vectors x = (x1, …, xm) and y = (y1, …, ym). Define a generalized distance of the form • We call this a pairwise distance function as the pairing of features within observations is preserved. BINF636 CLUSTERING AND CLASSIFICATION
Minkowski Metric • Special case of our generalized metric BINF636 CLUSTERING AND CLASSIFICATION
Euclidean and Manhattan Metric BINF636 CLUSTERING AND CLASSIFICATION
Correlation-based Distance Measures • Championed for use within the microarray literature by Eisen. • Types • Pearson’s sample correlation distance. • Eisen’s cosine correlation distance. • Spearman sample correlation distance. • Kendall’s t sample correlation. BINF636 CLUSTERING AND CLASSIFICATION
Pearson Sample Correlation Distance (COR) BINF636 CLUSTERING AND CLASSIFICATION
Eisen Cosine Correlation Distance (EISEN) BINF636 CLUSTERING AND CLASSIFICATION
Spearman Sample Correlation Distance (SPEAR) BINF636 CLUSTERING AND CLASSIFICATION
Tau Kendall’s t Sample Correlation (TAU) BINF636 CLUSTERING AND CLASSIFICATION
Some Observations - I • Since we are subtracting the correlation measures from 1, things that are perfectly positively correlated (correlation measure of 1) will have a distance close to 0 and things that are perfectly negatively correlated (correlation measure of -1) will have a distance close to 2. • Correlation measures in general are invariant to location and scale transformations and tend to group together genes whose expression values are linearly related. BINF636 CLUSTERING AND CLASSIFICATION
Some Observations - II • The parametric methods (COR and EISEN) tend to be more negatively effected by the presence of outliers than the non-parametric methods (SPEAR and TAU) • Under the assumption that we have standardized the data so that x and y are m-vectors with zero mean and unit length then there is a simple relationship between the Pearson correlation coefficient r(x,y) and the Euclidean distance BINF636 CLUSTERING AND CLASSIFICATION
Mahalanobis Distance • This allows data directional variability to come into play when calculating distances. • How do we estimate S? BINF636 CLUSTERING AND CLASSIFICATION
Distances and Transformations • Assume that g is an invertible possible non-linear transformation g: x x’ • This transformation induces a new metric d’ via BINF636 CLUSTERING AND CLASSIFICATION
Distances and Scales • Original scanned fluorescence intensities • Logarithmically transformed data • Data transformed by the general logarithm BINF636 CLUSTERING AND CLASSIFICATION
Experiment-specific Distances Between Genes • One might like to use additional experimental design information in deterring how one calculates distances between the genes. • One might wish to used smoothed estimates or other sorts of statistical fits and measure distances between these. • In time course data distances that honor the time order of the data are appropriate. BINF636 CLUSTERING AND CLASSIFICATION
Standardizing Genes BINF636 CLUSTERING AND CLASSIFICATION
Standardizing Arrays (Samples) BINF636 CLUSTERING AND CLASSIFICATION
Scaling and Its Implication to Data Analysis - I • Types of gene expression data • Relative (cDNA) • Absolute (Affymetrix) • xgi is the expression of gene g on sample I as measured on a log scale • Let ygi = xgi – xgA; patient A is our reference • The distance between patient samples BINF636 CLUSTERING AND CLASSIFICATION
Scaling and Its Implication to Data Analysis - II BINF636 CLUSTERING AND CLASSIFICATION
Scaling and Its Implication to Data Analysis - III The distance between two genes are given by BINF636 CLUSTERING AND CLASSIFICATION
Summary of Effects of Scaling on Distance Measures • Minkowski distances • Distance between samples is the same for relative and absolute measures • Distance between genes is not the same for relative and absolute measures • Pearson correlation-based distance • Distances between genes is the same for relative and absolute measures • Distances between samples is not the same for relative and absolute measures BINF636 CLUSTERING AND CLASSIFICATION
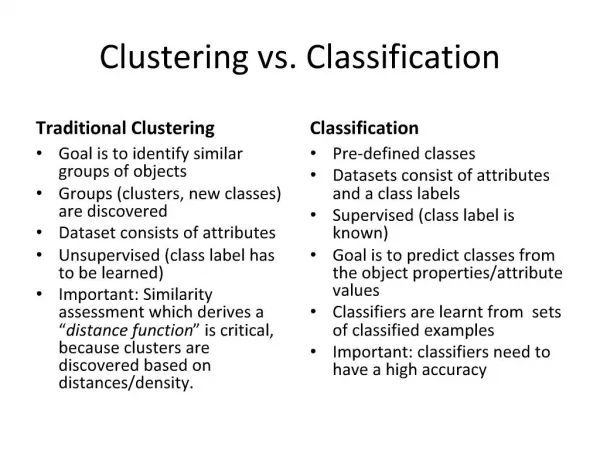
What is Cluster Analysis? • Given a collection of n objects each of which is described by a set of p characteristics or variables derive a useful division into a number of classes. • Both the number of classes and the properties of the classes are to be determined. (Everitt 1993) BINF636 CLUSTERING AND CLASSIFICATION
Why Do This? • Organize • Prediction • Etiology (Causes) BINF636 CLUSTERING AND CLASSIFICATION
How Do We Measure Quality? • Multiple Clusters • Male, Female • Low, Middle, Upper Income • Neither True Nor False • Measured by Utility BINF636 CLUSTERING AND CLASSIFICATION
Difficulties In Clustering • Cluster structure may be manifest in a multitude of ways • Large data sets and high dimensionality complicate matters BINF636 CLUSTERING AND CLASSIFICATION
Clustering Prerequisites • Method to measure the distance between observations and clusters • Similarity • Dissimilarity • This was discussed previously • Method of normalizing the data • We discussed this previously • Method of reducing the dimensionality of the data • We discussed this previously BINF636 CLUSTERING AND CLASSIFICATION
The Number of Groups Problem • How Do We Decide on the Appropriate Number of Clusters? • Duda, Hart and Stork (2001) • Form Je(2)/Je(1) where Je(M) is the sum of squares error criterion for the m cluster model. The distribution of this ratio is usually not known. BINF636 CLUSTERING AND CLASSIFICATION
Optimization Methods • Minimizing or Maximizing Some Criteria • Does Not Necessarily Form Hierarchical Clusters BINF636 CLUSTERING AND CLASSIFICATION
Clustering Criteria The Sum of Squared Error Criteria BINF636 CLUSTERING AND CLASSIFICATION
Spoofing of the Sum of Squares Error Criterion BINF636 CLUSTERING AND CLASSIFICATION
Related Criteria • With a little manipulation we obtain • Instead of using average squared distances betweens points in a cluster as indicated above we could use perhaps the median or maximum distance • Each of these will produce its own variant BINF636 CLUSTERING AND CLASSIFICATION
Scatter Criteria BINF636 CLUSTERING AND CLASSIFICATION
Relationship of the Scattering Criteria BINF636 CLUSTERING AND CLASSIFICATION
Measuring the Size of Matrices • So we wish to minimize SW while maximizing SB • We will measure the size of a matrix by using its trace of determinant • These are equivalent in the case of univariate data BINF636 CLUSTERING AND CLASSIFICATION
Interpreting the Trace Criteria BINF636 CLUSTERING AND CLASSIFICATION
The Determinant Criteria • SB will be singular if the number of clusters is less than or equal to the dimensionality • Partitions based on Je may change under linear transformations of the data • This is not the case with Jd BINF636 CLUSTERING AND CLASSIFICATION
Other Invariant Criteria • It can be shown that the eigenvalues of SW-1SB are invariant under nonsingular linear transformation • We might choose to maximize BINF636 CLUSTERING AND CLASSIFICATION
k-means Clustering • Begin initialize n, k, m1, m2, …, mk • Do classify n samples according to nearest mi Recompute mi • Until no no change in mi • Return m1, m2, .., mk • End • Complexity of the algorithm is O(ndkT) • T is the number of iterations • T is typically << n BINF636 CLUSTERING AND CLASSIFICATION
Example Mean Trajectories BINF636 CLUSTERING AND CLASSIFICATION
Optimizing the Clustering Criterion • N(n,g) = The number of partitions of n individuals into g groups N(15,3)=2,375,101 N(20,4)=45,232,115,901 N(25,8)=690,223,721,118,368,580 N(100,5)=1068 Note that the 3.15 x 10 17 is the estimated age of the universe in seconds BINF636 CLUSTERING AND CLASSIFICATION
Hill Climbing Algorithms 1 - Form initial partition into required number of groups 2 - Calculate change in clustering criteria produced by moving each individual from its own to another cluster. 3 - Make the change which leads to the greatest improvement in the value of the clustering criterion. 4 - Repeat steps (2) and (3) until no move of a single individual causes the clustering criterion to improve. • Guarantees local not global optimum BINF636 CLUSTERING AND CLASSIFICATION