Download
1 / 31
310 likes | 334 Vues
Review statistics concepts through cumulative test questions from Chapter 7. Analyze mean, median, quartiles, box plots, and more.

E N D
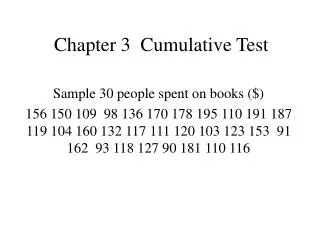
CUMULATIVE TEST REVIEW Statistics and Chapter 7
STATISTICS QUESTION ONE 12, 18, 22, 25, 27, 30, 31, 65 • Find the mean, median, and quartile values of the data. • Is the mean or the median the best representation of the data, explain.
STATISTICS QUESTION ONE • The mean is 28.75. • The median is 26. • Quartile One is 20. • Quartile Three is 30.5 • The median is the best measure because it is not impacted by the outlier as much as the mean.
STATISTICS QUESTION TWO The box plot A shows the age of males in an independent living facility. The box plot B shows the age of females in an independent living facility. What conclusions can you make about the median age of males and females and the variability of their ages. A (male) B (female)
STATISTICS QUESTION TWO • The median age of the two groups is the same. The range of the ages of the women is greater than that of the men.
STATISTICS QUESTION THREE Use the means and standard deviations of the graphs below to compare and describe the test scores for teenagers taking the written driver’s test. Age 16 applicants Age 18 applicants
STATISTICS QUESTION THREE • They have the same mean. • The standard deviation of the 16 year olds is larger than that of the 18 year olds because the data is more spread out.
CHAPTER 7 QUESTION SEVEN • Graph • State the domain and range
CHAPTER 7 QUESTION SEVEN • Domain: All Reals • Range: All Reals
CHAPTER 7 QUESTION EIGHT • Given • Describe the horizontal shift. • Describe the vertical shift. • What is the domain? • What is the range?
CHAPTER 7 QUESTION EIGHT • A) 3 left • B) 1 down • C) x ≥ -3 • D) y ≥ -1
CHAPTER 7 QUESTION NINE • f(x) = x + 4 and g(x) = 3x - 1 • Find: f(x) + g(x)
CHAPTER 7 QUESTION NINE • Domain: All Reals
CHAPTER 7 QUESTION TEN • f(x) = x + 4 and g(x) = 3x – 1 • Find:
CHAPTER 7 QUESTION TEN • Domain: All reals except -4.
CHAPTER 7 QUESTION ELEVEN • f(x) = x + 4 and g(x) = 3x – 1 • Find: g(f(x))
CHAPTER 7 QUESTION TWELVE • Find the inverse of .