Download

1 / 14
180 likes | 215 Vues
Learn the basics of demand and supply in the market, including concepts like substitute and complementary goods, demand schedule, supply schedules, and factors affecting supply curves. Understand how prices, costs, and profits influence market equilibrium. Discover how changes in supply impact the entire market. Explore how various factors can shift both demand and supply curves to create market dynamics.

E N D
Demand Review • What is Demand? • Give an example of substitute goods • Give an example of complementary goods • What is a demand schedule? • Is price on the horizontal or vertical axis?
Introduction to Supply • Supply refers to the various quantities of a good or service that producers are willing to sell at all possible market prices. • Supply can refer to the output of one producer or to the total output of all producers in the market (market supply).
Introduction to Supply • A supply schedule is a table that shows the quantities producers are willing to supply at various prices
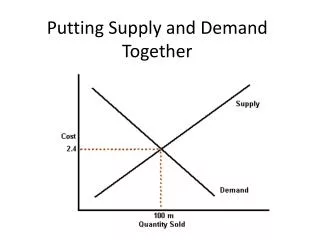
Introduction to Supply • A supply schedule can be shown as points on a graph. • The graph lists prices on the vertical axis and quantities supplied on the horizontal axis. • Each point on the graph shows how many units of the product or service a producer (or group of producers) would willing sell at a particular price. • The supply curve is the line that connects these points.
Introduction to Supply • As the price for a good rises, the quantity supplied rises and the quantity demanded falls. As the price falls, the quantity supplied falls and the quantity demanded rises. • The law of supply holds that producers will normally offer more for sale at higher prices and less at lower prices.
Introduction to Supply • The reason the supply curve slopes upward is due to costs and profit. • Producers purchase resources and use them to produce output. • Producers will incur costs as they bid resources away from their alternative uses.
Introduction to Supply • Businesses provide goods and services hoping to make a profit. • Profit is the money left over after a business covers its costs. • Businesses try to sell at prices high enough to cover their costs with some profit left over. • The higher the price for a good, the more profit a business will make after paying the cost for resources.
Changes in Supply • Change in the quantity supplied due to a price change occurs ALONG the supply curve • If the price of Widgets fell to $2, then the Quantity Supplied would fall to 4 Widgets.
Changes in Supply • Supply Curves can also shift in response to the following factors: • Subsidies and taxes: government subsidies encourage production, while taxes discourage production • Technology: improvements in production increase ability of firms to supply • Other goods: businesses consider the price of goods they could be producing • Number of sellers: how many firms are in the market • Expectations: businesses consider future prices and economic conditions • Resource costs: cost to purchase factors of production will influence business decisions • STONER: factors that shift the supply curve
Changes in Supply • Several factors will change the demand for the good (shift the entire demand curve) • As an example, suppose that there is an improvement in the technology used to produce widgets.
Changes in Supply • Supply can also decrease due to factors other than a change in price. • As an example, suppose that a large number of Widget producers go out of business, decreasing the number of suppliers.
Changes in Supply Changes in any of the factors other than price causes the supply curve to shift either: • Decrease in Supply shifts to the Left (Less supplied at each price) OR • Increase in Supply shifts to the Right (More supplied at each price)