Download
1 / 28
280 likes | 311 Vues
Explore the impact of pollution in China due to heavy industrialization and high population density. Learn how remote sensing tools like OMI, MODIS, and MOPITT are used to track pollution patterns and effects, aiding in monitoring and reducing pollution levels.

E N D
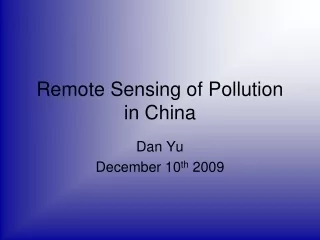
Remote Sensing of Pollution in China Dan Yu December 10th 2009
Why China? • Heavy Industrialization • Large increase in primary energy consumption mainly fueled by coal • Large Population • Adverse health effects, premature deaths (3/4 of a million due to air and water pollution) • Lack of extensive ground-based monitoring system
Population Density www.temis.nl
Select Remote Sensing Tools Considered: • OMI • MOPITT • MODIS • SeaWiFS • Calipso • SCIAMCHY
OMI • Ozone Monitoring Instrument • On board NASA Aura • Can provide global coverage in a day • Measure key air quality components • Distinguish between aerosol types • Combination of algorithms used to extract data
OMI Average (2005-2006) SO2 burdens over China http://tes.jpl.nasa.gov/uploadedfiles/Eldering_IGARSS_09_v2b.pdf
http://disc.sci.gsfc.nasa.gov/oceancolor/additional/science-focus/locus/air_pollution.shtml#omihttp://disc.sci.gsfc.nasa.gov/oceancolor/additional/science-focus/locus/air_pollution.shtml#omi
MODIS • Moderate Resolution Imaging Spectroradiometer • On board Terra (EOS AM) and Aqua (EOS PM) • Captures data in 36 spectral bands • Images the entire Earth every 1 to 2 days • Multitude of uses
http://earthobservatory.nasa.gov/NaturalHazards/event.php?id=10524http://earthobservatory.nasa.gov/NaturalHazards/event.php?id=10524
2007 Algal Bloom http://nasadaacs.eos.nasa.gov/articles/2008/2008_algae.html
http://disc.sci.gsfc.nasa.gov/oceancolor/additional/science-focus/locus/air_pollution.shtml#omihttp://disc.sci.gsfc.nasa.gov/oceancolor/additional/science-focus/locus/air_pollution.shtml#omi
Aerosol Particle Size Hong Kong http://disc.sci.gsfc.nasa.gov/oceancolor/additional/science-focus/locus/air_pollution.shtml#omi
SeaWiFS • Sea-viewing Wide Field-of-view Sensor • Onboard OrbView-2 (AKA SeaStar) • Specifically designed to monitor ocean characteristics…
http://earthobservatory.nasa.gov/NaturalHazards/event.php?id=10524http://earthobservatory.nasa.gov/NaturalHazards/event.php?id=10524
MOPITT • Measurements of Pollution in the Troposphere • Onboard Terra • Measure pollution patterns and effects in lower atmosphere • Mainly CO, but can measure methane • First to use gas correlation spectroscopy • Swaths are 640 km wide
http://earthobservatory.nasa.gov/NaturalHazards/view.php?id=10533http://earthobservatory.nasa.gov/NaturalHazards/view.php?id=10533
Calipso • Cloud-Aerosol Lidar and Infrared Pathfinder Satellite Observations • Part of A Train • Actively measures global aerosols and clouds • Provides data on altitude of aerosol layers in the atmosphere
http://disc.sci.gsfc.nasa.gov/oceancolor/additional/science-focus/locus/air_pollution.shtml#omihttp://disc.sci.gsfc.nasa.gov/oceancolor/additional/science-focus/locus/air_pollution.shtml#omi
http://disc.sci.gsfc.nasa.gov/oceancolor/additional/science-focus/locus/air_pollution.shtml#omihttp://disc.sci.gsfc.nasa.gov/oceancolor/additional/science-focus/locus/air_pollution.shtml#omi
http://www-calipso.larc.nasa.gov/products/lidar/browse_images/show_detail.php?s=expedited&v=V2-02&browse_date=2009-08-08&orbit_time=18-00-00&page=1&granule_name=CAL_LID_L1_Exp-Prov-V2-02.2009-08-08T18-00-00Z.hdfhttp://www-calipso.larc.nasa.gov/products/lidar/browse_images/show_detail.php?s=expedited&v=V2-02&browse_date=2009-08-08&orbit_time=18-00-00&page=1&granule_name=CAL_LID_L1_Exp-Prov-V2-02.2009-08-08T18-00-00Z.hdf
http://disc.sci.gsfc.nasa.gov/oceancolor/additional/science-focus/locus/air_pollution.shtml#omihttp://disc.sci.gsfc.nasa.gov/oceancolor/additional/science-focus/locus/air_pollution.shtml#omi
SCIAMACHY • SCanning Imaging Absorption SpectroMeter for Atmospheric CartograpHY • Onboard ENVISAT • Primary Objective: Perform global measurements of trace gases in the troposphere and in the stratosphere.
http://www.sron.nl/images/stories/news/2008/scia_metaan_04.jpghttp://www.sron.nl/images/stories/news/2008/scia_metaan_04.jpg
Conclusions • Many remote sensing tools can be used • Many other remote sensors not discussed • Overlaps • Strides to reduce pollution in China • Remote sensors will help track progress • Tracking of areas for federal compliance
Thanks! Questions?
Works Consulted • NASA • www.nasa.gov/ • NASA Images • www.nasaimages.org/ • Tropospheric Emission Monitoring Internet Service • www.temis.nl • Netherlands Institute for Space Research • www.sron.nl • University of Bremen Institute of Environmental Physics • http://www.iup.uni-bremen.de/eng/