Internal Environment Analysis: RBV in Coca-Cola Vs Pepsi
Stock analysts compare Coca-Cola and Pepsi based on tangible and intangible assets, organizational capabilities, and resource valuation criteria. The text explores the importance of tangible assets, intangible assets, and organizational capabilities in creating a competitive advantage. It also delves into what makes a resource valuable and key resources across functional areas in the context of strategic management stages. The analysis covers functions like planning, organizing, motivating, staffing, controlling, and production management decision-making processes.

Internal Environment Analysis: RBV in Coca-Cola Vs Pepsi
E N D
Presentation Transcript
Resource-Based View of the Firm (RBV) Coca-Cola Vs Pepsi Illustration : Stock analyst look at the two and frequently conclude that Coke is the clear leader. They cite Coke’s superiority in tangible assets (warehouse, bottling facilities, computerization, cash etc) and intangible assets (reputation, brand name awareness, tight competitive culture, global business system). They also mention that Coke leads Pepsi in several capabilities to make use of these assets effectively-managing distribution globally, influencing retailer shelf space allocation, managing franchise bottler relations, marketing savvy, investing in bottling infrastructure, and speed of decision making to take quick advantage of changing global condition
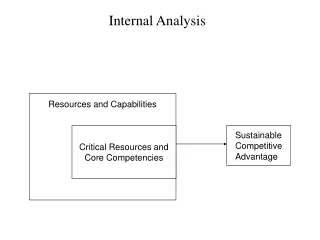
Three Basic Resource Tangible Assets, are the easiest to identify and often found on a firm’s balance sheet. They include production facilities, raw materials, financial resources, real estate and computers. Tangible assets are the physical and financial means a company uses to provide value to its customers. Intangible Assets, are not assets that you can touch or see, they are very often critical in creating competitive advantage like brand name, company reputation, organizational morale, technical knowledge, patent & trade mark and accumulated experiences Organizational Capabilities, are not specific inputs like tangible and intangibles assets, they are skill-the ability and ways of combining assets, people and process to transform inputs to outputs.
What Makes a Resource Valuable • Competitive superiority : Does the resources help fulfill a customer’s need better than competitors ? • Resource scarcity : Is the resource in short supply ? • Inimitability : Is the resource easily copied or acquired ? • Physically unique resources • Path-dependent resource • Causal ambiguity • Economic deterrence • Appropriability : Who actually gets the profit created by a resource? • Durability : How rapidly will the resource depreciate • Substitutability : Are other alternatives available ?
The Basic Function of Management Function Description Stage of Strategic Management Planning Planning consist of all managerial activities to preparing for the future . Specific task include forecasting, establishing objective, devising strategy, developing policies and setting goals Strategy Formulation Organizing Organizing include all managerial activities that result in a structure of task and authority relationship. Specific areas include organization design , job specialization, job description, job specification, span of control, unity of command, coordination, job design, and job analysis. Strategy Implementation Motivating Motivating involves efforts directed toward shaping human behavior. Specific topics include leadership, communication, work group, behavior mo dification, delegation of authority, jog enrichment, job satisfaction, needs ful- fillment , organizational change, employee morale and managerial morale Strategy Implementation Staffing Staffing activities are centered of personal and human resource management. Include wage and salary administration, employee benefit, in- terviewing, hiring, firing, training, development, employee safety, affirmative action, etc Strategy Implementation Controlling Controlling refers to all those management activities directed toward ensure that actual result are consistent with plan results. Key areas of concern include quality, financial control, sales control, inventory control, expense control, analysis of variance, rewards and sanction Strategy Evaluation
The Basic Function of Production Management Function Description Process Process decision concern the design of the physical production system. Specific decision include choice of technology, facilities layout, process flow analysis, facility location, line balancing, process control, and transportation. Capacity Capacity decision concern determination of optimal output levels for the organization-not too much and not too little. Specific decision include forecasting, facilities planning, aggregate planning, scheduling, capacity planning, and queuing analysis. Inventory Inventory decision involve managing the level of raw material, work-in-process, and finished good. Specific decision include what to order, when to order, how much to order, and materials handling. Workforce Workforce decision are concerned with managing the skilled, unskilled, clerical, and managerial employees. Specific decision include job design, work measurement, job enrichment, work standard, and motivation technique. Quality Quality decision are aimed at ensuring that high-quality good and services are produced. Specific decision include quality control, sampling, testing, quality assurance, and cost control
Analysis of Strength and Weaknesses A Few Tools For Internal Analysis Finance and Accounting : Capital asset pricing model, payback period, accounting return, present values, internal rate of return, financial ratios, fixed and variable budget Human Resources : Turn over analysis, morale surveys, training budget, analysis of personal needs and capabilities. Marketing : Sales forecast, market share analysis, price volume relationship, sales force analysis, product and market lines analysis. Operation : Inventory analysis, aggregate and shop-floor analysis, break event analysis, labor, material and overhead-cost analysis R & D : Patent generated, project analysis, value analysis.
Value Chain General Administration Human Resource Management Margin Support Activities Research, Technology and System Development Procurement Marketing And Sales Inbound Logistic Outbound Logistic Service Operation Primary Activities Margin
Primary Activities Activities, cost and assets associated with : Inbound Logistic : Fuel, energy, raw materials, parts component, merchandise, consumable items from vendors, suppliers. Operation : converting inputs into final product from (production, assembly, packaging, equipment maintenance, facilities, operation, quality assurance, environmental protection). Outbound Logistic : physical distributing product to buyers (finish good warehousing, order processing, order picking and packing, shipping, delivery vehicles Marketing and Sales : sales force, advertising and promotion, market research, dealer and distributor support. Service : providing assistance to buyers (installation, spare parts, maintenance and repair, technical assistance, buyers inquiry, complain.
Support Activities Activities, cost and assets associated with : General Administration: general management, accounting and finance, legal and regulatory, safety and security, management information system, other overhead function. Human Resource Management : recruitment, hiring, training, development and compensation, labor relation, development of knowledge base skill. Research, Technology and System Development: product R&D, process design and improvement, equipment design, computer software development, telecommunication system, new data base capabilities Procurement: purchasing and providing raw materials, supplies, services, outsourcing
Translate Value Chain Activity to Competitive Advantage Competencies and capabilities gradually emerge in certain competitively important value chain activities Company proficiency in performing one or two value chain activities rises to the level of a core competence Company proficiency in performing a core competence continuous to build and evolve in to a distinctive competence Company gains a basis for sustainable competitive advantage Company performs activities in its value chain
Strategic Advantage Profile Internal Area Competitive Strength or Weakness Marketing + Product line is extensive, and service is excellence - Channels of distribution are weak in the southwest R & D - No R & D performed Operations + Excellence sourcing of raw materials - Facilities are old and becoming out of date Corporate Resources 0 Company size is about average of the industry 0 Profit has been consistent but average - Union employees complain frequently Finance + Balance sheet show ability to obtain needed capital, low debt equity ratio, high working capital and favorable stock price
Internal Factors Evaluation (IFE) List key internal factors, use a total of 10-20 internal factors, list strength first and then weaknesses Assign a weight that range from 0,00 (not important) to 1,00 (all-important), internal strength or weaknesses that have greatest effect on org’ performance should be assigned highest weight Assign 1-4 rating to each factor to indicate that factor represent a major weakness (rating=1), a minor weakness (rating=2), a minor strength (rating=3), a major strength (rating=4). Rating is company based, weighting is Industry based Multiply each factor to determine score, and sum the score to determine total score of the organization.
Internal Factor Evaluation (IFE) Matrix Key Internal Factors Weight Rating Score Strength Inventory turn over increased from 5,8 to 6,7 0,10 3 0,30 Average customer purchase increased from $9,7 to $ 12,8 0,15 4 0,60 Employee morale is excellence 0,10 3 0,30 In-stores promotion resulted in 20 percent increased in sales 0,15 3 0,45 Weaknesses Revenue from software segment of store down 12% 0,10 3 0,30 Location of store negatively impacted by new Highway 0,15 4 0,60 Bathroom in store need refurbishing 0,10 3 0,30 Revenue from businesses down 8% 0,15 3 0,45 1,00 3,30 Total
SWOT Analysis Strength, is resource advantage relative to competitors and the need of the market a firm serve or expect to serve. Weaknesses, is limitation or deficiency in one or more resources or competencies relative to competitors that impedes a firm’s effective performance. Opportunities, is a major favorable situation in a firm’s environment Threats, is a major unfavorable situation in a firm’s environment
SWOT Analysis Diagram Numerous environmental opportunities Cell 3 : Support a turn around oriented Strategy Cell 1 : Support an aggressive strategy Substantial internal strength Critical internal weaknesses Cell 2 : Support a diversification strategy Cell 4 : Support a defensive strategy Major environmental threat
Tugas-4 A. Case Pelajari case anda masing2 kelompok Identifikasi faktor2 Marketing, Finance, Operation / Production, Management, IS/IT dan R&D Buatlah SAP untuk case tersebut Tugas dikumpulkan hari H-1 pertemuan berikut dalam bentuk power point melalui email. Text Book Pelajari buku wajib chapter 5 “Strategies in Action” untuk dipresentasikan pertemuan berikut.