Internal Business Analysis: Defining Success through Metrics and Performance Measures
This chapter delves into the internal analysis of a business, focusing on how to define a company's operations across various parameters such as geography, product packaging, and market segments. It emphasizes profitability metrics like profit margin, asset turnover, and return on assets, along with performance measures reflecting long-term profitability and customer satisfaction. Additionally, it discusses strategic implications of product pricing, cost reduction, and value analysis, allowing businesses to align their operational strategies with market demands effectively.


Internal Business Analysis: Defining Success through Metrics and Performance Measures
E N D
Presentation Transcript
Chapter Six Internal Analysis
How do we define the business? • Hawaii • Western U.S. • U.S. • North America • Global
How do we define the business? • Packaged • Fountain
How do we define the business? • Cans • Bottles • 6 pack • 12 pack • 24 pack
How do we define the business? • Restaurants • C-stores • Movies • Others
How do we define the business? • Coke • Diet Coke • Sprite • Fanta • Mr. Pibb • Other
Market Share Total Sales Total Market Sales
Market Share Total Sales Total Market Sales
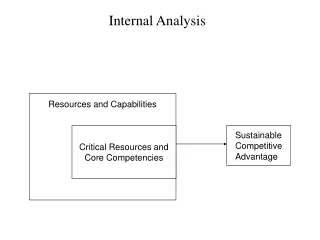
Profitability • Profit • Profit Margin • Asset Turnover • R.O.A. (return on assets)
Profit • Bottom line on the P&L
Profit Margin • Profit divided by sales
Asset Turnover • Sales divided by average total assets
R.O.A. • Profit margin times asset turnover
Homework: Calculate • Profit Margin • Asset turnover • Return on Assets
Performance Measures ReflectingLong-Term Profitability Customer Satisfaction/ Brand Loyalty Long Term Profits Product/Service Quality Current Performance Brand/Firm Associations Relative Cost New Product Activity Manager/Employee Capability/Performance Heritage and Values Chapter 6 - Internal Analysis Figure 6.1
Performance Measures ReflectingLong-Term Profitability Customer Satisfaction/ Brand Loyalty Long Term Profits Current Performance Product/Service Quality Brand/Firm Associations Relative Cost New Product Activity Manager/Employee Capability/Performance Heritage and Values Chapter 6 - Internal Analysis Figure 6.1
Performance Measures ReflectingLong-Term Profitability Customer Satisfaction/ Brand Loyalty Long Term Profits Product/Service Quality Current Performance Brand/Firm Associations Relative Cost New Product Activity Manager/Employee Capability/Performance Heritage and Values Chapter 6 - Internal Analysis Figure 6.1
More Expensive Inferior Superior Less Expensive Relative Cost vs. Relative Performance - Strategic Implications • Change • Design • Manufacturing/Systems • Ignore • Value Analysis • Raise prices • Promote • Cost Reduction Our Component is • Value Analysis • De-emphasize • Upgrade • Value Analysis • Emphasize/promote • Leave it alone Chapter 6 - Internal Analysis Figure 6.2
More Expensive Inferior Superior Less Expensive Relative Cost vs. Relative Performance - Strategic Implications • Change • Design • Manufacturing/Systems • Ignore • Value Analysis • Raise prices • Promote • Cost Reduction Our Component is • Value Analysis • De-emphasize • Upgrade • Value Analysis • Emphasize/promote • Leave it alone Chapter 6 - Internal Analysis Figure 6.2
More Expensive Inferior Superior Less Expensive Relative Cost vs. Relative Performance - Strategic Implications • Change • Design • Manufacturing/Systems • Ignore • Value Analysis • Raise prices • Promote • Cost Reduction Our Component is • Value Analysis • De-emphasize • Upgrade • Value Analysis • Emphasize/promote • Leave it alone Chapter 6 - Internal Analysis Figure 6.2
More Expensive Inferior Superior Less Expensive Relative Cost vs. Relative Performance - Strategic Implications • Change • Design • Manufacturing/Systems • Ignore • Value Analysis • Raise prices • Promote • Cost Reduction Our Component is • Value Analysis • De-emphasize • Upgrade • Value Analysis • Emphasize/promote • Leave it alone Chapter 6 - Internal Analysis Figure 6.2
More Expensive Inferior Superior Less Expensive Relative Cost vs. Relative Performance - Strategic Implications • Change • Design • Manufacturing/Systems • Ignore • Value Analysis • Raise prices • Promote • Cost Reduction Our Component is • Value Analysis • De-emphasize • Upgrade • Value Analysis • Emphasize/promote • Leave it alone Chapter 6 - Internal Analysis Figure 6.2
Performance Measures ReflectingLong-Term Profitability Customer Satisfaction/ Brand Loyalty Long Term Profits Product/Service Quality Current Performance Brand/Firm Associations Relative Cost New Product Activity Manager/Employee Capability/Performance Heritage and Values Chapter 6 - Internal Analysis Figure 6.1
Performance Measures ReflectingLong-Term Profitability Customer Satisfaction/ Brand Loyalty Long Term Profits Product/Service Quality Current Performance Brand/Firm Associations Relative Cost New Product Activity Manager/Employee Capability/Performance Heritage and Values Chapter 6 - Internal Analysis Figure 6.1
Performance Measures ReflectingLong-Term Profitability Customer Satisfaction/ Brand Loyalty Long Term Profits Product/Service Quality Current Performance Brand/Firm Associations Relative Cost New Product Activity Manager/Employee Capability/Performance Heritage and Values Chapter 6 - Internal Analysis Figure 6.1
Chapter Six Internal Analysis See Netlix Values PDF
Performance Measures ReflectingLong-Term Profitability Customer Satisfaction/ Brand Loyalty Long Term Profits Product/Service Quality Current Performance Brand/Firm Associations Relative Cost New Product Activity Manager/Employee Capability/Performance Heritage and Values Chapter 6 - Internal Analysis Figure 6.1
Benchmarking Defined “Benchmarking is the process of comparing one’s business processes and performance metrics to industry bests and/or best practices from other industries. Dimensions typically measured are quality, time, and cost. Improvements from learning mean doing things better, faster, and cheaper.”
Walmart (all numbers in thousands)
Walmart (all numbers in thousands)
Costco (all numbers in thousands)
Costco (all numbers in thousands)