Download

1 / 21
210 likes | 361 Vues
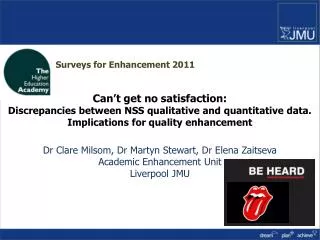
Surveys for Enhancement 2011. Learning from the NSS: can’t get no satisfaction……. Can’t get no satisfaction: Discrepancies between NSS qualitative and quantitative data. Implications for quality enhancement Dr Clare Milsom , Dr Martyn Stewart, Dr Elena Zaitseva

E N D
Surveys for Enhancement 2011 Learning from the NSS: can’t get no satisfaction…… Can’t get no satisfaction: Discrepancies between NSS qualitative and quantitative data. Implications for quality enhancement Dr Clare Milsom, Dr Martyn Stewart, Dr Elena Zaitseva Academic Enhancement Unit Liverpool JMU "This year's National Student Survey is a wake-up call to university vice-chancellors. They must buck up their ideas and do far more to improve the experience they offer students.” Aaron Porter NUS president
Purposes of the NSS Quality assurance Student choice Improvement of the student learning experience (quality enhancement) “This year's National Student Survey is a wake-up call to university vice-chancellors. They must buck up their ideas and do far more to improve the experience they offer students.“ Aaron Porter July 2010
The structure of the NSS questionnaire is appropriate (dimensionality of the data) • Definitely agree • Mostly agree • Neither agree nor disagree • Mostly disagree • Definitely disagree
‘Factor analysis identified the six NSS factors that the NSS was designed to measure but it also considered that assessment and feedback should be considered as separate factors’ (Marsh and Cheng 2008:6) ‘broad evidence for the integrity of the six original scales, and there was some evidence for two additional dimensions relating to feedback and workload’(Richardson et al. 2007: 578)
The NSS questionnaire shows satisfactory levels of internal consistency and validity • Definitely agree • Mostly agree • Neither agree nor disagree • Mostly disagree • Definitely disagree
‘..proved to be remarkably robust’ ‘satisfactory levels of internal consistency...construct validity...and concurrent validity’ (Richardson et al. 2007: 578) ‘our exploration of the NSS questionnaire indicated strong convergent validity ..and discriminant validity’(Fielding et al. 2010: 359) ‘Analysis of NSS data has repeatedly provided evidence the robustness of the instrument and conceptual validity of the dimensions of the student experience is assesses’(HEFCE2010: 9)
NSS responses are able to differentiate between institutions • Definitely agree • Mostly agree • Neither agree nor disagree • Mostly disagree • Definitely disagree
‘..2.5% of the variation in NSS scores for Overall Satisfaction is due to differences between institutions’.(Surridge 2010: 25) ‘there is much more variation in the responses by students within each university than there is between the different universities’ (Marsh and Cheng 2008:52). ‘we recommend that NSS ratings should only be used with appropriate caution for comparing universities.’ (Cheng and Marsh 2010: 709) Williams and Kane (2008) and HEFCE (2010)
NSS responses are able to differentiate between subjects of study • Definitely agree • Mostly agree • Neither agree nor disagree • Mostly disagree • Definitely disagree
‘especially to comparisons of different courses—either different courses within the same university or the same course across universities.’ (Cheng and Marsh 2010: 709) ‘complex relationship between survey questions and subject studied was found in many areas’ (Fielding et al. 2010: 365) ’The students with the highest satisfaction score were those undertaking historical and philosophical studies or physical sciences. ... Those studying creative arts and design gave the lowest score...’ (HEFEC 2010 Findings and Trends 2006-9) ‘because of the differences between subjects, it is not sensible to expect similar profiles of scores across all subjects.’ (Vaughan and Yorke 2009:32)
Commenting on the results from the National Student Survey 2010, Universities and Science Minister David Willetts said: ‘I want to ensure prospective students have comprehensive, up-to-date and comparable information about what is on offer.’ ‘It is desirable to make available clear guidance about the risks and issues associated with using NSS results for the purposes of comparison’ HEFCE July 2010 ‘Focus on the what steps need to be taken to move forward and improve rather than concentrating on over analysing the scores’ ‘Aspirational and evidence-based approaches.’ Flint et al. (2009)
‘Where a survey is intended to be used formatively ..... enhancement activities .... an instrument of reasonable quality may be ‘good enough’ for the purpose’ ‘If the survey is summative in intention (NSS) its technical qualities become more important’ (Yorke 2010:734)
LJMU NSS approach: Formative intention with summative action Faculty
2011 LJMU Academic Enhancement Unit Qualitative analysis of open response (free text) questions ‘The data constitute another possible source of sector-wide information about quality, and descriptive information .... which is not currently exploited’. (HEFCE 2010:25)
Meta analysis ‘students did not generate any categories of comments that were associated with their perceptions of quality of their programmes and not addressed...’ (Richardson et al. 2007: 571)
Open response (free text) alignment: subject reporting group Text analytics tool Conceptual structure Visual representation
Implications for quality enhancement “Peace is not the absence of conflict, but the presence of justice.” HEFCE 2010 Rec. 8 ‘Development of analytical tool to enable institutions to analyse free text area of NSS in a consistent manner’
CHERI (2010) Enhancing and Developing the National Student Survey. London: HEFCE • Cheng , J.H.S , and Marsh, H.W. (2010) 'National Student Survey: are differences between universities and courses reliable and meaningful?' Oxford Review of Education, 36(6): 693-712. • Fielding, A., Dunleavy, P.J., and Langan, A.M (2010) Interpreting context to the UKs national student (Satisfaction) survey data for science subjects. Journal of Further and Higher Education, 34(3), 347-368. • Flint, A., Oxley, A., Helm, P., and Bradley, S. (2009), “Preparing for success: one institution's aspirational and student focused response to the National Student Survey”, Teaching in Higher Education 14 (6): 607-618 • HEFCE (2010), National Student Survey: Findings and trends 2006 to 2009. London: HEFCE • Marsh, H.W., Cheng, J.H.S. (2008) Dimensionality, multilevel structure, and differentiation at the level of university and discipline: Preliminary results. HEA York • Richardson, J.T. E., Slater, J. B. and Wilson, j. (2007) The National Student Survey: development, findings and implications. Studies in Higher Education, 32(5), 557–580. • Surridge, P. (2009), The National Student Survey three years on: What have we learned? York: Higher Education Academy • Surridge, P. (2006), The National Student Survey 2005: Findings. London: HEFCE • Vaughan, D. And orke, M. (2009) I can’t believe it’s not better’: The Paradox of NSS scores for Art & Design. HEA York • Williams, J. and Kane, D. (2008) Exploring the National Student Survey Assessment and feedback issues. HEA, York. • Yorke, M. (2009) Student experience' surveys: some methodological considerations and an empirical investigation. Assessment and Evaluation in Higher Education, 34 (6), 21-739.