Download
1 / 8
80 likes | 192 Vues
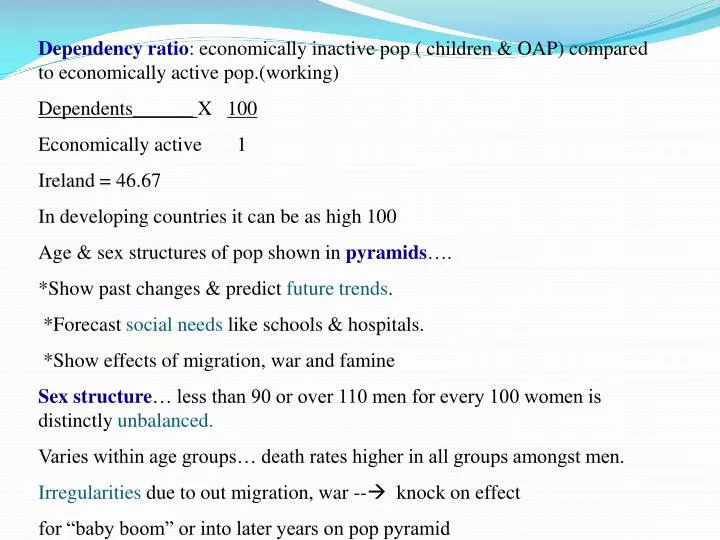
Dependency ratio : economically inactive pop ( children & OAP) compared to economically active pop.(working) Dependents______ X 100 Economically active 1 Ireland = 46.67 In developing countries it can be as high 100 Age & sex structures of pop shown in pyramids ….

E N D
Dependency ratio: economically inactive pop ( children & OAP) compared to economically active pop.(working) Dependents______ X 100 Economically active 1 Ireland = 46.67 In developing countries it can be as high 100 Age & sex structures of pop shown in pyramids…. *Show past changes & predict future trends. *Forecast social needs like schools & hospitals. *Show effects of migration, war and famine Sex structure… less than 90 or over 110 men for every 100 women is distinctly unbalanced. Varies within age groups… death rates higher in all groups amongst men. Irregularities due to out migration, war -- knock on effect for “baby boom” or into later years on pop pyramid
Dependency Ratio Large young pop…. EG developing world 36% under 15…. Huge buying power. Large families put strain on family income… educ, clothes & food… find it hard to save Large old pop….. Social impact.. Tax burden & services like health, educ can suffer. EG India 86 million over 60.
Case study: Japan • In 1920’s Japan moved through stages 2 and 3 caused by baby boom after 2 world wars • 1950 Japan developed and pop growth slowed • 2011 BR is 1.3 well below sustainable level of 2.1 • Initiatives and allowances to encourage bigger families despite its huge pop. • Percentages • Older people increasing and young people decreasingBy 2025 26% of pop over 65 compared with 12% in 1990. • One of most populous countries in world @ 830 per sq km • (phsyiologic density would be 3,070) • Birth rate in decline… cost of caring for older pop huge… • Japan ‘greying’ population • Effect can be lessened by: • Postpone retirement • Encourage inward migration from Philippines
Ireland-Pop patterns and density-changes over time. • Density 54 per km sq. • Distribution and density uneven • Lowest in western region • Inhospitable landscape, climate and poor soils • Pop low even in fertile areas as land required for agriculture • Highest density in Urban areas which are concentrated in coastal lowlands and river valleys
Change over time: • 1960’s 2.6 million, lowest population • 1960’s boom during Lemass Era, economic policies and tax incentives • MNC jobs, inward migration, • EEC membership in 1973, opened European markets to Irish products and population increased for 1st time in 120 yrs
1980’s recession, emigration (200,000 people emigrated in the 1980’s) • 1990’s boom Celtic Tiger, inward migration, urbanisation, large west to east migration • Rapid greying pop, 11% over 65 • Under 15 year is down by 10% since 1970 • Economically active age group increased from 58% to 68% in 45yrs • Dependency ratio highest 74% in 1966, now 46% increasing • TFR 1.98
Life Expectancy from 1926 to present • Men 57.4 – 76.8 yrs • Women 57.9 – 81.6 yrs • Advance s in Health care, Dr Noel Browne eradicated TB by 1957, improved maternity services and immunistaion • Greying population can lead to socio-economic problems e.g. Nursing homes, greater tax burden etc.
China • 1949-76 fertility rate 6 per mother • 1979 1 child policy • Urban areas 1 child, rural areas 2 • Imbalances of sexes: 106.7 to 100 girls • Increased illegal abortions based on sex • 95.7% of abortions female • 90% of children in orphanages girls • Moved from stage 2 to stage 4 in short period • Population still increasing 9 million a year as marry young