The Relationship with Large Enterprises in the Supply Chain
Malcolm Walker 27th May 2010. The Relationship with Large Enterprises in the Supply Chain. Who’s Mal Walker About Logistics Bureau What is Supply Chain Management? What are its components? Supply Chain Models Retail Wholesale Direct Inventory Management Inventory Strategies

The Relationship with Large Enterprises in the Supply Chain
E N D
Presentation Transcript
Malcolm Walker 27th May 2010 The Relationship with Large Enterprises in the Supply Chain
Who’s Mal Walker About Logistics Bureau What is Supply Chain Management? What are its components? Supply Chain Models Retail Wholesale Direct Inventory Management Inventory Strategies JIT, VMI, EOQ Collaboration & Partnerships Benchmarking Multiple Sourcing Third Party Logistics Agenda
Mal Walker – Manager, Consulting Qualifications & Background Key Skills Relevant Experience 30 years operational and consulting experience Has worked with: Colby Handling Systems (now Dematic) building and implementing materials handling systems in both Australia and South East Asia. TTC – Implementing VAM and JIT strategies to Australian industry Peter Breed and Partners – Management Consultants Symonds Henderson – Logistics and Supply Chain Consultants DHL Supply Chain – Third Party Logistics Logistics Bureau – Supply Chain Consultants Clients: Rheem, George Weston Foods, Energex (Qld) , Fuji Xerox, Toll, Olympus, THP Vietnam, Dept Familes and Communities (Adel) , EAC (Jakarta), Gold City Footwear (Bangkok), Distribution Centre and Facility location Warehouse Design 3rd Party Logistics Inventory Management (Vendor and Owner Managed and Postponement Strategies) Network Planning and Modeling Surveys and Feasibility Studies Project Management Cert ME B Bus (Admin and Operations) (UTS) Grad Dip Transport and Logistics (RMIT)
The company was founded in 1997 by and is owned by, Rob O’Byrne, who remains the Group Managing Director. The company has now expanded across the Asia Pacific Region and incorporates the following businesses: For businesses looking for increased Competitive Advantage, Logistics Bureau provides direction and support in driving improved profitability, improved customer service and increased Supply Chain flexibility. We do this by: Ensuring that Supply Chain & Logistics strategies are aligned with business goals Improving sales with higher product availability to the customer Reducing working capital Reducing the cost of goods sold (COGS) Reducing the costs of doing business (CODB) Elimination of waste Developing and executing sound improvement plans Logistics Bureau Introduction Logistics Bureau is the largest Logistics and Supply Chain specific consulting business in the Region and specialises in all aspects of Supply Chain from source to consumer. 13 years 1,000+ projects in 18 countries
What is Logistics vs Supply Chain Management The Academic perspective.. Logistics • That part of the supply chain process that plans, implements, and controls the efficient, effective flow and storage of goods, services, and related information from the point of origin to the point of consumption in order to meet customers’ requirements. • Council of Supply Chain Management Professionals 2010 Supply Chain Management • The planning and management of all activities involved in sourcing and procurement, conversion, and all logistics management activities. Importantly, it also includes coordination and collaboration with channel partners, which can be suppliers, intermediaries, third party service providers, and customers. In essence, supply chain management integrates supply and demand management within and across companies. • CSCMP 2010 • The integration of key business processes from end user through original suppliers, that provides products, services and information that add value for customers and other stakeholders. • D Lambert, M Cooper & J Pugh 1998
What is Supply Chain Management? The practitioners perspective… What suppliers, manufacturers, wholesalers, retailers and customers want? The electronic and physical management of materials, goods and services from point of origin to point of consumption, at the lowest total cost, with: • Trace ability; • Efficiency; • Visibility; • Timeliness. • Plus anyone who has ever purchased something, and/or attempted to manage a supply chain and/or logistics process. • Mal Walker
4PL1 3PL The Evolution of Supply Chains `` Supply-driven Chain Demand-driven Value Chain Year 2010 1980 1985 1990 1995 2000 2005 Process Optimisation Early build To order (Dell) JIT VMI Supplier Park Build to forecast Dynamic Supply Chains Internet B2B B2C High visibility Systems ERP Systems Supply Chain Optimisation EDI Lean Manufacturing(minimise inventory, eliminate waste) Agile Supply Chain(increase responsiveness) (1) Trademark registered by Accenture in 1996, with Modifications by M Walker 2010
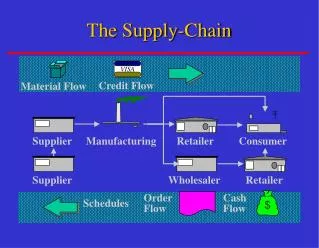
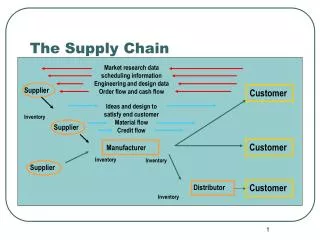
The Integrated Supply Chain Material Flow Source Make Store Ship Store Pick/Pack Transport Deliver Information Flow Demand Event Mgt Dispatch Tracking Receiving WMS PODs Cust Info
<50 km <400 km <800 km >800 km Supply Chain Networks • Align inventory deployment with service • Consider fast / slow networks • Outsource facilities to maintain flexibility • Review transport modes • Monitor network performance
Case Study: Australian Heater Manufacturer8 DC Network • This map depicts the distance between customers and the DC’s that service them. • Distance is coloured according to the legend below. • Customer Isochrones are used to consider service levels and transport lead-times across global networks. • A relatively small proportion of customer throughput (8%) is transported greater than 400 kilometres, highlighting the need to understand the true ‘cost to serve’ in these instances.
Re Modelled Network to 3 DCs and 2 Satellites • This map depicts the distance and flows between the customers and the DC’s that service them under the revised scenarios. • Distance is coloured according to the legend below. • Flows have been significantly simplified. Factors influencing this are: • Reduced stock transfers between sites; • Strict DC to DC and DC to customer service relationships.
The Supply Chain Processes (Ref SCOR Model) Five key processes of the Supply Chain DELIVER • PLAN SOURCE MAKE RETURN Assess resources Determine demand of product Plan inventory for distribution Plan production Plan material requirements Raw materials and Finished Goods Obtain Receive Inspect Hold Issue Payment Order management Compile orders Assemble as required Pick, pack, dispatch Local Delivery or export Get paid Receive materials Manufacture Test product Package Release product distribution Warranty claims, Defective goods Replacement Inspection Credit process
Balancing the variables Long term objective Changeover costs Short term objective Savings High risk Low risk Transport costs Rental ROI Capital costs Labour costs Technology Inventory cost Customer Service
Which is your SME?One with a steady stream of Profit, or has it dried up?
Two Key Imperatives of the Supply ChainYou must have these to compete…. • Lowest Total Cost • Includes: • Order Placement Costs incl credit checking • Documentation • Order Picking • Delivery • Invoicing and Collection • Reliable Service Times • Incoming: Supply in Full on Time (SIFOT) • Measured from point of first request, until delivered into facility • Outgoing: Delivery in Full on Time (DIFOT) • Measured from point of order until signed Proof of Delivery (POD) received
Four Guiding Principles for Logistics and Supply Chain Management • One way flow of materials and services. • Minimal materials handling. • Apply technology wisely, according to volumes. • Lowest total cost to supply. • Whatever you do, use these principles and they will guide your strategies to deal with adverse Economic conditions.
What do you do when Economic Crisis Looms? • Review your costs: • Operating Expenses • Selling Expenses • Labour • Inputs to Manufacturing • Inventory (stock) quantities • Transportation and delivery charges • Import/export Charges • Review your Products • A, B C analysis • Obsolete items • Reduce Stock • Tools • Time Based Management: to increase the value added ratio • Supply strategies • Inventory Strategies • EOQ • Just in Time • Vendor Managed Inventory • Benchmarking • KPIs • Design for flow
Time Based Management – Increase the Value Adding (VA) ratio Initial Supply Chain Time = 4 weeks VA VA VA Receive Move Set up Machine Make Move Assemble Move Store Order Pick, Pack Dispatch Deliver Invoice Value Adding Ratio = 6 days / 28 = 21% Improved Lead Time = 1.5 weeks By eliminating wasted time from the process you can improve lead time to market reduce cost, and increase profits. VA VA VA Value Adding Ratio = 4 days / 10 = 40%
Sourcing • Balance lead time & cost • Currency exposure • Balance local v offshore supply • Improve supplier performance • Improve supply visibility
Sourcing • Sourcing: Apply Strategic Thinking aligned to products/ value that they create. • Build partnerships with key suppliers. • Treat your suppliers with respect, but quality and timeliness should never be sacrificed. • Never have only 1 supplier. Adopt a ‘dual’ sourcing strategy. • Beware of the costs and conditions of importation and exportation.
Purchasing Product PortfolioStrategy according to the type of product High • Leverage Products • Alternative Sources • Substitution possible • Competitive Bidding • Strategic Products • Critical for Product’s cost price • Dependence on supplier • Performance Based • Partnership Purchasing Impact on Financial Risk • Routine Products • Large product variety • High logistics complexity • Labour intensive • E Commerce Solutions • Bottleneck Products • Monopolistic market • Larger Entry barriers • Secure Supply + search for alternatives Low Low High Complexity of product and process
Inventory Pareto • After separating slow moving and dead stock, it is shown that very compressed group of active products accounted for large percentage of COGS between June 2009 to April 2010. • A long tail suggested that there is a very high number of slow moving products. Class C 82% or 2193 item codes accounted for only 5% of COGS, or 1% of sales volume movement between June 09 to April 10 5% or 143 item codes accounted for 80% of COGS between June 09 to April 10. Class B Class A
Inventory Management – The basics Holding Inventory is necessary to supply your market • Storing inventory costs money • Purchase cost • Human capital • Finance Costs • Management Costs • Systems costs • Procurement Costs • Rent, utilities etc. • General Principles: • Only hold as much as you need to meet demand. • Order stock in good time to meet the demand of your market. • Plan for variations in stock demand by holding safety stock. • Review frequently to ensure the ‘right’ amount of stock is held. • Companies turn over inventory at different rates: • Spare parts 1-6 times per year • White and brown goods 4-8 • Consumer durables 4-8 timers per year • Imported Dry foods 6-10 • FMCG 20-40 • Fresh Food 30-60 • The higher number, the better!!
Sales of Quidditch Accessories in April 2010eg Quaffles, Broomsticks, Golden Snitches, Bludgers etc (Total 30 Products) • What’s this telling you about Hogwartz’s sales? • What are your conclusions? • Any recommendations to Harry and team?
Sales of Hogwartz Enterprises Products in April 2010: Revised 80% of unit sales is from 6 items • Now what do you conclude? • What's your advice to the Hogwarts team? 15% from 8 items 5% from 16 items
The Forrester Effect (Bullwhip) Supply chain demand profile Consumer demand - low variability Retailer demand on warehouse Demand on factory Demand on factory bears no resemblance to demand by consumers.
Inventory Management Models • Economic Order Quantity • Just in Time • Vendor Managed Inventory • Postponement
Economic Order Quantity • Optimises the holding cost and ordering cost • Calculates the least total cost to order the product • Assumes: • Constant Setup costs • Constant Lead time • Constant Holding costs • But, does not take into account daily demand • Used by manufacturers not by wholesalers and resellers • Is a production ‘push’ strategy EOQ
Example: Economic Order Quantity Balances holding stock, with ordering cost and setup. The problem it that you are forced to hold more stock than is needed per day over the entire ordering cycle • Economic Order Quantity (EOQ) • A = Annual usage • S = Ordering Cost • I = Inventory cost • EOQ = 2AS i • If • A = 1000 • S = $100 • I = 25% of item cost • Item cost = $40 • Then: • EOQ = 2x1000x100 40x0.25 = 141 Units
EOQ – Production Push Model • Inventory pushed out in batches • Pushed to wholesaler and then to consumer • Strength: Good utilisation of capital assets i.e. machinery • Problem: too much inventory
Just in Time • Developed initially by Henry Ford, but refined and mastered by Toyota. • Uses customer ‘pull’ philosophy. • Goods are delivered to customers and each stage in production, ‘just in time’ for consumption. • Its major premise is elimination of wasted time and resources e.g. set up times, and inventory. • Used widely in manufacturing industries and service industries. • Uses ‘Kanban’ cards or signaling systems. • Example: Milk vendors, motor car assembly lines • Results • Reduces waste and stock in the chain • Lower total cost to make and supply • Reduces non value adding time • Reduces inventory piles • Downside: can come unstuck in periods of high demand due to minimal stock piles.
JIT – Demand Pull Model • Customer demand pulls stock through the supply chain • Strength: low inventory • Weakness: In volatile or unpredictable times, lack of stock can result in shortages of supply
Vendor Managed Inventory • This concept moves the responsibility of managing the stock from the user back up the chain to the supplier. • The user only pays for the stock when the goods are used. • The ideas is that the vendor delivers the stock to the supplier and owns the goods until the supplier draws from them. • Some systems provide for a recipient generated invoice. • Where goods are not used, the products can be taken back by the vendor e.g. Bread supply to retail stores. • Results: works well for large volume supplies, but it must be set up with the necessary systems to place to track inventory and raise payments on a ‘as used’ basis. • Examples: Bread in retails stores, Supply of consumables stock in printing industry, Technology Products.
Vendor Managed Inventory Supply Model • Supply model that relies on the vendor to manage stock to the customer • Strength: end customer has virtually no inventory on its books, even though it will be holding it. • Weakness: Forces stock back to the SME, but overall cost may still be lower.
Factory Gate Pricing Model • Relies on the customer to pick up goods from the gate of the supplier. (ex works) • Strength: Customer can save money in transport • Weakness: SME can be vulnerable to customer manipulation.
Postponement • Postponement refers to the practice of delaying final assembly or configuration of products until just before they are needed. • Is commonly used in brown and white goods industries, computers, fashion and automotive industries. • Ideal for imported and exported productsResults: Used to good effect by companies such as Dell, Zara, Fuji Xerox.
Situation Analysis • Where are you now? • Where do you want to be? • What’s the gap & and what’s the cost/benefit? • How can you close the gap?
Benchmarking Data • Key cost and performance measures were compiled by ABC in the prescribed format which is comparable to companies within the Benchmarking Success data base. • Seven KPIs were derived from the data for both ABC – Audio, and ABC Video • The results are shown in the table below and then represented graphically against industry benchmarks overleaf. • The derivation of each is also described overleaf.
BEST PRACTICE Champions Challengers™ - Level 1 Metrics ABC leads and lags 0 ------------------Performance------------ KPI Warehouse as % Gross Sales > 2.94% < 1.96% Comparisons with Database of 41 similar supply chains including: Austsoft, Corporate Express, Hanimex,Hardy Spicer, Harper Collins, John Sands, Penguin, Quicksilver, Vodafone, etc. Returns as % Gross Sales > 2% < 1% Outbound Transport as % Gross Sales > 1.94% < 1.62% Customer Service as % Gross Sales > 0.75% < 0.5% Supply chain Cost/order > $91.74 < $31.85 Supply chain Cost/line > $19.50 < $9.09 Ave Inventory as % Sales > 11.84% < 9.19% Legend Disadvantage Parity Advantage Audio Products Video Products Metrics supplied by
Newco Level 1 Supply Chain Metrics Champions Challengers® 'Disadvantage'' 'Parity' 'Advantage' Newco Div 1 BIC Total Supply Chain Mgmt Cost % Sales Stockturns Finished Goods DIFOT in-full x on-time Cash to Cash Cycle Time Delivery in-full by line 93% Delivery on-time < 95% < 88% < 5 turns > 12.3% < 93% > 45 days 88 - 94% 95 - 97% 12.3 - 8.0% 45 - 34 93 - 97% 5 - 11 < 34 days > 94% > 11 turns > 97% < 8.0% > 97% 99% 97% 99% 90% 98% 8.5% 5.9% 77 days 31 days 4 turns 22 turns Please see 1.3 for comparison dataset information and Appendix 2 for Definitions of Metrics.
Newco Level 1 Supply Chain Metrics Champions Challengers® 'Disadvantage'' 'Parity' 'Advantage' Newco Div 2 BIC Total Supply Chain Mgmt Cost % Sales Cash to Cash Cycle Time Delivery in-full By Unit Stockturns Finished Goods DIFOT in-full x on-time 42% Delivery on-time Delivery in-full by line is not measured. Each order is loaded as a separate machine unless it is a dealer order. >46 days > 11.1% < 79% < 5 turns < 93% < 85% 5 - 9 79 - 94% 85 - 97% 46 - 32 93 - 97% 10.9 - 6.9% < 32 days < 6.9% > 94% > 97% > 97% > 9 turns 99% 45% 98% 20% 97% 6.6% 5.3% -29 days 20 days 6 turns 12 turns Please see 1.2 for comparison dataset information and Appendix 2 for Definitions of Metrics. Figure 11: Champions Challengers – Level 1 Supply Chain Metrics