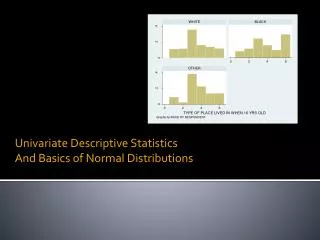
Univariate Descriptive Statistics
Univariate Descriptive Statistics. Heibatollah Baghi, and Mastee Badii George Mason University. Objectives. Define measures of central tendency and dispersion. Select the appropriate measures to use for a particular dataset. How to Summarize Data?.

Univariate Descriptive Statistics
E N D
Presentation Transcript
Univariate Descriptive Statistics Heibatollah Baghi, and Mastee Badii George Mason University
Objectives • Define measures of central tendency and dispersion. • Select the appropriate measures to use for a particular dataset.
How to Summarize Data? • Graphs may be useful, but the information they offer is often inexact. • A frequency distribution provides many details, but often we want to condense a distribution further.
Two Characteristics of Distributions • Measures of Central Tendency. • Measures of Variability or Scatter.
Measures of Central Tendency: Mean • The mean describes the center or the balance point of a frequency distribution. The sample mean: • Calculate the mean value for the following data: 23, 23, 24, 25, 25 ,25, 26, 26, 27, 28. • 25.2
Measures of Central Tendency: Mode • The most frequent value or category in a distribution. • Calculate the mode for the following set of values: 20, 21, 21, 22, 22, 22, 22, 23, 23, 24. • 22
Measures of Central Tendency: Median • The middle value of a set of ordered numbers. • Calculate for an even number of cases. • 21, 22, 22, 23, 24, 26, 26, 27, 28, 29. • 25 • Calculate for odd number of data with no duplicates: 22, 23, 23, 24, 25, 26, 27, 27, 28. • 25 • Median changes when data at center repeats.
Comparison of Measures of Central Tendency in Normal Distribution • Mean, median and mode are the same • Shape is symmetric
Comparison of Measures of Central Tendency in Bimodal Distribution • Mean & median are the same • Two modes different from mean and median
Comparison of Measures of Central Tendency in Negatively Skewed Distributions • Mean, median & mode are different • Mode > Median > Mean Outliers pull the mean away From the median
Comparison of Measures of Central Tendency in Positively Skewed Distributions • Mean, median & mode are different • Mean > Median > Mode Outliers pull the mean away From the median
Comparison of Measures of Central Tendency in Uniform Distribution • Mean, median & mode are the same point
Comparison of Measures of Central Tendency in J-shape Distribution • Mode to extreme right • Mean to the right of median
Measures of Variability or Scatter • Reporting only an average without an accompanying measure of variability may misrepresent a set of data. • Two datasets can have the same average but very different variability.
Measures of Variability or Scatter: Range • The difference between the highest and lowest score • Easy to calculate • Highly unstable • Calculate range for the data: 110, 120, 130, 140, 150, 160, 170, 180, 190 • 190 – 110 = 80
Measures of Variability or Scatter: Semi Inter-quartile Range • Half of the difference between the 25% quartile and 75% quartile • SQR = (Q3-Q1)/2 • More stable than range
Measures of Variability: Sample Variance • The sum of squared differences between observations and their mean [ss = Σ(X - M)2 ] divided by n -1. • Sample variance : Standard deviation squared • Formula for sample variance
Measures of Variability or Scatter: Standard Deviation • The squared root of the variance. • Calculate standard deviation for the data: 110, 120, 130, 140, 150, 160, 170, 180, 190.
Calculating Standard Deviation • Sample Sum of Squares: • Sample Variance • Sample Standard Deviation SS is the keyto many statistics
Calculating Standard Deviation SS is the keyto many statistics
Comparison of Measures of Variability and Scatter • In Normal Distribution • Range ~ 6 standard deviation • Standard Deviation partitions data in Normal Distribution
Standardized Scores: Z Scores • Mean & standard deviations are used to compute standard scores Z = (x-m) / s • Calculate standard deviation for blood pressure of 140 if the sample mean is 110 and the standard deviation is 10 • Z = 140 – 110 / 10 = 3
Value of Z Scores • Allows comparison of observed distribution to expected distribution Expected Observed
Take Home Lesson Measures of Central Tendency & Variability Can Describe the Distribution of Data