Queuing Systems: basic elements
This guide explores the fundamental concepts of queuing systems, highlighting the basic elements, including arrival and service patterns, queue discipline, and system characteristics. It delves into performance measurement metrics like system utilization, average number of customers in line, and waiting times. Additionally, it covers the trade-offs in total costs associated with capacity and customer waiting, and how queuing theory can be applied in process design and operations. Statistical process control is also discussed, emphasizing variability management and process capability.
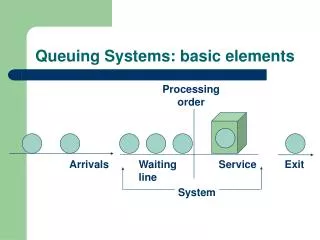

Queuing Systems: basic elements
E N D
Presentation Transcript
Processing order Arrivals Waiting line Service Exit System Queuing Systems: basic elements
Queuing Systems: multiple phases Multiple channel Multiple phase
Modeling with Queuing Theory • System Characteristics • Population source: finite, infinite • No. of servers • Arrival and service patterns: e.g. exponential distribution for inter-arrival time • Queue discipline: e.g. first-come-first-serve
Measuring Performance • Performance Measurement: • System utilization • Average no. of customers: in line and in system • Average waiting time: in line and in system • e.g. infinite source, single server, exponential inter-arrival and service times, first-come-first-serve: (see handout)
Basic Tradeoff Total cost Customer waiting cost Capacity cost = + Total cost Cost Cost of service capacity Cost of customers waiting Service capacity Optimum
Basic Tradeoff (cont.) Average number on time waiting in line 0 100% System Utilization
Applying Queuing Theory • In Process Design: • Describe the process and establish a model • Collect data on incoming and service patterns • Find formulas and/or tables, software to calculate performance measures • Use performance measures to guide process design decisions
Applying Queuing Theory • In Operations: • Monitor performance measures • Use performance measures to guide process improvement and operations decisions
Statistical Process Control • Emphasis on the process instead of the product/material • Focus on “prevention”
Abnormal variationdue to assignable sources Out ofcontrol UCL Mean Normal variationdue to chance LCL Abnormal variationdue to assignable sources 0 1 2 3 4 5 6 7 8 9 10 11 12 13 14 15 Sample number Control Chart
1 2 3 4 In-Control: random only UCL LCL Sample number
Control Charts for Variables • Mean Chart: measuring sample means • Range Chart: measuring sample ranges i.e. max-min
UCL x-Chart LCL UCL LCL Out-of-Control: assignable & randomshifted mean process mean is shifting upward Sampling Distribution Detects shift Does notdetect shift R-chart
UCL Does notreveal increase x-Chart LCL UCL Out-of-Control: assignable & randomincreased variability Sampling Distribution (process variability is increasing) R-chart Reveals increase LCL
a/2 a/2 Mean LCL UCL a = Probabilityof Type I error Type I Error:
Mean Type II Error: In-Control Out-of-Control LCL UCL
Control Charts for Attributes • p-Chart - Control chart used to monitor the proportion of defectives in a process • c-Chart - Control chart used to monitor the number of defects per unit
Counting Above/Below Median Runs (7 runs) B A A B A B B B A A B Counting Up/Down Runs (8 runs) U U D U D U D U U D Counting Runs Figure 10-11 Figure 10-12
LowerSpecification UpperSpecification Process variability matches specifications LowerSpecification UpperSpecification Process variability well within specifications LowerSpecification UpperSpecification Process variability exceeds specifications Process Capability
Process Capability: 3-sigma & 6-sigma Upperspecification Lowerspecification 1350 ppm 1350 ppm 1.7 ppm 1.7 ppm Processmean +/- 3 Sigma +/- 6 Sigma
Input/Output Analysis • Change in inventory = Input - Output • Average throughput time is proportional to the level of inventory.
Input flow of materials Inventory level Scrap flow Output flow of materials Flow and Inventory Figure 11.1
MRP • A general framework for MRP • Inputs: Bill of Materials, Inventory Files and Master Production Schedule • MRP Processing
Aggregate Plan A General Framework of MRP Master Production Schedule MRP Capacity Requirements Planning Production Scheduling
C (1) Seat subassembly H (1) Seat frame I (1) Seat cushion J (4) Seat-frame boards Bill of Materials Figure 15.10
Inventory Files • On-Hand • Open Orders • Lead Times • Vendor Information • Quality records, etc.
Item: Seat subassembly Lot size: 230 units Lead time: 2 weeks Week 1 2 3 4 5 6 7 8 Gross requirements 0 0 0 0 150 120 150 120 Scheduled receipts 0 0 0 0 0 0 0 230 Projected on-hand inventory 37 117 117 227 227 77 187 187 117 Planned receipts 230 230 Planned order releases 230 230 MRP Explosion Figure 15.11
Item: Seat subassembly Lot size: 230 units Lead time: 2 weeks Week 1 2 3 4 5 6 7 8 Gross requirements 0 0 0 0 150 120 150 120 Planned receipts 230 230 Planned order releases 230 230 Usage quantity: 1 Usage quantity: 1 Item: Seat frames Lot size: 300 units Lead time: 1 week Item: Seat cushion Lot size: L4L Lead time: 1 week Week Week 1 2 3 4 5 6 7 8 1 2 3 4 5 6 7 8 Gross requirements Gross requirements 230 0 230 230 0 230 0 0 0 0 Scheduled receipts Scheduled receipts 300 0 0 0 0 0 0 0 0 0 0 0 0 0 0 0 Projected on-hand inventory Projected on-hand inventory 40 0 Planned receipts Planned receipts Planned order releases Planned order releases MRP Explosion Figure 15.11
Issues in MRP • Two basic concepts: • Net requirements • Lead time offset • Lot size • Safety stock/Safety lead time • Inventory records • Validity of the schedules
JIT and Inventory Management • Inventory as delay in work flow • Why inventory? • Dealing with fluctuations in demand • Dealing with uncertainty • Reducing transaction costs • Taking advantage of quantity discount • Hedging against inflation, etc.
JIT and Inventory Management • Inventory costs: • Holding cost • Long response time • Low flexibility • Slow feedback in the system
JIT and Inventory Management • The objective of JIT: • General: reduce waste • Specific: avoid making or delivering parts before they are needed • Strategy: • very short time window • mixed models • very small lot sizes.
JIT and Inventory Management • Prerequisites: • Reduce set up time drastically • Keep a very smooth production process • Core Components: • Demand driven scheduling: the Kanban system • Elimination of buffer stock
JIT and Inventory Management • Core Components: (cont.) • Process Design: • Setup time reduction • Manufacturing cells • Limited work in process • Quality Improvement