Download
1 / 10
100 likes | 237 Vues
E 4 GeV. Final results on atmospheric oscillations with MACRO at Gran Sasso. Bari, Bologna, Boston, Caltech, Drexel, Frascati, Gran Sasso, Indiana, L’Aquila, Lecce, Michigan, Napoli, Pisa, Roma1, Texas, Torino, Oujda Gran Sasso Lab. – MACRO oscillations. Atmospheric neutrinos

E N D
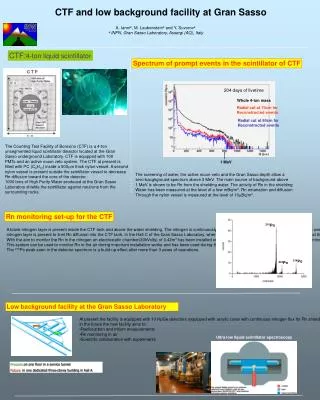
E 4 GeV Final results on atmospheric oscillations with MACRO at Gran Sasso Bari, Bologna, Boston, Caltech, Drexel, Frascati, Gran Sasso, Indiana, L’Aquila, Lecce, Michigan, Napoli, Pisa, Roma1, Texas, Torino, Oujda Gran Sasso Lab. – MACRO oscillations.Atmospheric neutrinos Upthroughoing muons (E 50 GeV ) Zenith distribution Absolute value L/E distribution: E from M.C.S. Monte Carlos Semicontained muons Upstopping muons Combining all information Conclusions Ratio Absolute value G. Giacomelli University of Bologna EPS, Aachen
- Oscillations Weak flavour eigenstates e, , Mass eigenstates1, 2, 3 Decays, Interactions + + , n-p Propagation 1(t) = 1(0) e-E t Mixing 1 = 3m = 1 Ulm m 2-Flavour = 2 cos23 + 3 sin 23 Mixing = -2 cos23 + 3 sin 23 Oscillations in Vacuum (over a distance L) Disappearance P( ) = 1 – sin2 223 sin2 (1.27 m223 L/E) Appareance P( ) = 1 – P( ) m223 = m23 – m22 Simple formulae -Additional flavour oscillations Modified by -Matter effects In case of -Neutrinos have masses m≠ 0 Oscillations -Le, L, L, L violation -neutrino decays
Atmospheric neutrinos E : 0.1 GeV 100 GeV L : 20 km 13000 km L/ E : 1 km/GeV 105 km/GeV Downgoing : “near” neutrino source Upgoing : “far” neutrino source
NIM A324(1993)337 NIM A486(2002)663 12 m horizontal Dimensions: 76.6 m in length 9.3 m height Subdivided in 6 supermodules, with a lower and an upper part The MACRO detector 3 types of Scintillators ( 600 t) Subdetectors Streamer tubes Nuclear track detectors Acceptance in : 10-4 1 S 10,000 m2 sr for isotropic flux
PL B357(1995)481 PL b434(1998)451 hep-ex/0206027 Upthroughgoing muons MC SIMULATION (17% scale error): Bartol Group flux Phys. Rev. D53 (1996) 1314 inter. Cross sections: Z. Phys. C67 (1995) 433 Transport in the rock CERN-EP / 85-03 (1985) Detector simulation: GEANT3 Shape of zenith distribution + L/E distribution m2 = 2.5 10-3 eV2, sin2 2 = 1 Significance ~ 4.7
Monte Carlos New FLUKA and HKKM: complete three dimensional MCs with improved hadronic model Predictions of FLUKA and HKKM agree perfectly Shapes of zenith distributions with and without oscillations are the same in old Bartol flux, new FLUKA and new HKKM Using the latest primary Cosmic Ray fits: Absolute values are ~ 20-30% lower than MACRO and SUPER K data Using previous Cosmic Ray fits: Absolute values are 5-10% lower than MACRO, SUPER K Need to improve these fits
NIM A492(2002)376 hep-ex/0304037 L/EDistribution ● Black points : upthroughgoing data ○ Open point : Internal Up (IU) data Green and red lines: MC predictions for oscillations with the mentioned parameters point-to-point syst. error (12%) Shaded region:
PL B478(2000)5 hep-ex/0206027 Zenith distributions for IU and (ID+UGS) 164 events < E > 4 GeV Shaded regions: no oscillation MC (21% scale error) Black lines: MC predictions for oscillations with m2 = 2.5 10-3 eV2 and sin2 2 = 1 Data are in agreement with MCOSC with the quoted parameters 262 events
Combination of indipendent data H.E. 50 GeV L.E. 4 GeV Absolute H.E. Scale error 17% Values L.E. Scale error 21% Zenith distrib. Energy measur. Conclusions MACRO data are consistent with oscillations, with Maximal mixing m2 = 0.0023 eV2 ( 5 significance)