Atmospheric Inversion results
Atmospheric Inversion results. Philippe Peylin LSCE, France Rachel Law CSIRO, Australia Kevin Gurney, Xia Zhang Arizona State University/Purdue University, USA Zegbeu poussi LSCE, France and model participants. 1 of these is previous T3 average.

Atmospheric Inversion results
E N D
Presentation Transcript
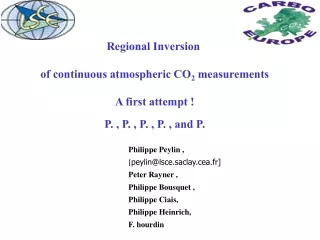
Atmospheric Inversion results Philippe Peylin LSCE, France Rachel Law CSIRO, Australia Kevin Gurney, Xia Zhang Arizona State University/Purdue University, USA Zegbeupoussi LSCE, France and model participants Viterbo RECCAP
1 of these is previous T3 average These exclude some submissions that were too short Tutorial 1 : Logistics • Results accessible at: http://transcom.lsce.ipsl.fr • Plotted maps and time series (“component” fluxes X aggregated regions) – no psswrd • Data files (“component” fluxes X aggregated regions and gridded) - psswrd • 11 “state of the art” inversions (some multiple submissions) • All re-gridded to a common grid (1°x1°, monthly) • “Component” fluxes = prior, fossil fuel, posterior (estimate) • “Regional” fluxes = land/ocean regions + various aggregates (109) • Region “mask” – boundaries of the chosen regional breakdown and aggregates (regular and extended) • We urge regional leads to contact “inverters” for additional clarification • The complete 1°x1°, monthly files are also available – “roll” your own regions “transcom”
Tutorial 2 : Participants We are choosing a start date of 1995 for RECCAP
Tutorial 3: Miscellaneous notes • Fossil emissions differed between inversions:Attempted “fix”: Fossil “adjustment” with common fossil fuel CO2 flux • Uncertainties: (in progress, Enting et al., Transcom) • “Bayesian” errors will be provided for key regions • Spread induced by changing model components available for few cases (contact individual modeler) • “Validation” against independent data (in progress) • Atm. Vertical profile, campaign, independent C-cycle obs, etc • Regridding & land/sea mask can create inaccuraciesspecial care for regions with shaped coastal boundaries
Website Thank you Zegbeu!
Tutorial 4: Proceed with Caution • Poorly-constrained region (Africa) • Well-constrained region (Europe)
4 continued: Consequences of poor constraints • Influence of prior • Sensitivity to an individual site Jena (dark blue) only inversion without EIC and very different E-W flux split Australian seasonal cycle from 4 inversions. Posterior (solid), prior (dashed). Different prior seasonality due to inclusion or not of biomass burning.
4 continued: Caution with “big region” estimates Annual total flux (GtC/yr) North Asia EUROPE “spurious” anti-correlations – a form of “representation error” • Large flux dipoles : « regional estimates should be interpreted with great care depending on the boundary of the regions
Results 1 : Long term means Natural fluxes (GtC/yr) – 2000-2003 period Northern land + ocean Tropical land + ocean LSCE_an_v2.1 JENA_s96_v3.2 CTracker_EU LSCE_var_v1. C13_MATCH CTracker_US TRCOM_me RIGC_patra JMA_2010 C13_CCAM NCAM_Niwa Southern land + ocean
The following results are preliminary and based on current submissions. These may change at a future time.
Results 1 : Long term means Natural fluxes (GtC/yr) – 2000-2003 period N. America N. Atlantic LSCE_var_v1. C13_MATCH CTracker_US LSCE_an_v2.1 JENA_s96_v3.2 CTracker_EU TRCOM_me RIGC_patra JMA_2010 C13_CCAM NCAM_Niwa Europe N. Asia
Results 2: IAV (land) LSCE_an_v2.1 JENA_s96_v3.2 CTracker_EU LSCE_var_v1. C13_MATCH CTracker_US TRCOM_me RIGC_patra JMA_2010 C13_CCAM NCAM_Niwa Total land Northern land Tropical land Southern land
Results 2: IAV (ocean) LSCE_an_v2.1 JENA_s96_v3.2 CTracker_EU LSCE_var_v1. C13_MATCH CTracker_US TRCOM_me RIGC_patra JMA_2010 C13_CCAM NCAM_Niwa Total ocean Northern ocean Tropical ocean Southern ocean
Results 2: IAV (continental scale) N. America N. Atlantic LSCE_var_v1. C13_MATCH CTracker_US LSCE_an_v2.1 JENA_s96_v3.2 CTracker_EU TRCOM_me RIGC_patra JMA_2010 C13_CCAM NCAM_Niwa N. Asia Europe
Mean IAV for all models Standard dev. of all models Results 3 : Seas. Cycle & IAV Seas. Cycle Mean amplitude of all models Standard dev. of all models IAV
Summary • New set of 11 inverse results (which includes TRcom3 mean as 1) • WEB-site available for downloading • Uncertainties & Validation in progress (part of Transcom) • Results may be updated with announcement • Proceed with caution together with “inverse” specialists • Differences in long term mean but coherence in IAVat large scales • Small scales regional results sensitive to: Network, Priors, Flux resolution…
Global Inversion Status/Plans • Results accessible at: http://transcom.lsce.ipsl.fr • 11 results available at 1°x1° & region (individual and aggregate: 109) • 1995 to 2008 (inc) but individuals will run back to 1980 – monthly/annual • Fluxes include: prior, fossil, posterior, total, “adjusted” fluxes • Region “mask” and explanation available • Updates will occur (we will announce) • Uncertainty work & decisions ongoing • Decision on a “weighted” mean ongoing • Proceed with caution (tentative “inverter” assignments made for ocean) • TransCom meeting: December San Francisco AGU