Download
1 / 34
340 likes | 362 Vues
Learn about extreme water resource management in the Delaware River Watershed. Understand the impacts of climate change and the actions needed to safeguard water resources. Explore facts, challenges, operating plans, future scenarios, and potential impacts on water supply and infrastructure. Discover how sea level rise, storm surges, salinity increases, and changes in snowpack affect water availability. Find out about the vulnerability of headwaters, critical protection areas, and the need for collaboration in adapting to climate change. Take action to ensure sustainable water management in the face of environmental challenges.

E N D
CLIMATE CHANGE IMPACTSActions Needed To ProtectThe Water Resources of the Delaware River Basin Jessica R. Sanchez, MCRP, PhD River Basin Planner Delaware River Basin Commission Carol R. Collier, PP, AICP Executive Director Delaware River Basin Commission
CLIMATE CHANGE IMPACTS Extreme water resource management
Delaware River Watershed Facts • Basin + Bay =13,539 mi² • 12,757 mi² Drainage (~ 0.4 of 1% of the continental US) • 330 miles: Longest undammed river east of the Mississippi • ~ 50% basin land is in PA • Over 15 million people rely on the waters of the basin (~ 5% of the US population)
In last 6 years, cumulative departure from “normal” >40inches or +6 inches per year since 2004 on average
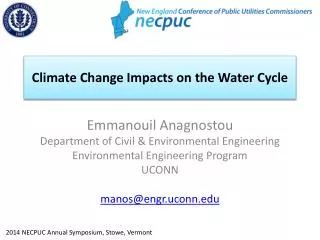
DROUGHT: Extreme Water Supply Planning Cannonsville Reservoir December 2001
Serial Flooding: Extreme Flood Mitigation • 3 record-breaking floods in 22 months: • Sept 2004 • April 2005 • June 2006
Variability within Extremes DRY WET
…and Changing Averages Rutgers – Office of NJ State Climatologist
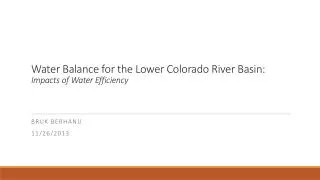
Flow Target @Trenton= 3000 cfs Philadelphia Intake 1964 2002 Salt Line Range Prepared by Philadelphia Water Dept
Critical Water Supply Areas 2 critical ground water areas Special withdrawal limits/ review thresholds Emphasis on conjunctive use- surface water alternative is crucial
Operating Plans NYC Delaware Basin Reservoirs drive the Basin-wide Operating Plan DRBC storage in 2 Army Corps reservoirs drive Lower Basin Operating Plan Beltzville Blue Marsh Merrell Creek Reservoir DRBC Drought Emergency Actions can mobilize additional 69 BG for flow augmentation Montague Trenton
Extremeissues • Is there sufficient storage to meet increases in demand…under a prolonged drought? • Is 3000 cfs target sufficient to support oysters, repel salt front and keep intakes safe? • Is 69 BG of emergency storage enough to meet flow needs…in the next drought emergency? • What more does climate change add to the stressors in our management scenarios?
Assumptions for Future Scenarios • Increasing Temperatures: > 2- 4o C • Equal or Increased Precipitation: > 7 – 9% • Greater Intensity of Storms • More Precip. in Winter Months • Warmer Summers (Higher Demand & ET) • Working at the Extremes • Floods and Droughts • Increase in Sea Level Rise • Inundation (height + tidal range change) • Storm Surge • Salinity Increases
Changes in Snowpack and Snowmelt • Less snow in the winter - affects water supply for many who depend on the melting of snowpack as a water source. • Timing of snowmelt - earlier snowmelt may require changes to how water supply reservoirs are managed.
Sea Level Rise Global Sea Level Rise Regional Changes gravity, ocean currents and ocean density subsidence Global + Regional 0.45 + 0.27 = 0.72m (2.3 ft) 1.4 + 0.27 = 1.67m (5.5. ft) Model 0.5 meter rise 1.0 meter rise 1.5 meter rise
SLR: Northeast US Regional Changes In the Northeast US sea level is rising much faster than the global average, most likely due to local land subsidence. Inferred subsidence rates are -0.6 to 2.7 mm yr-1. Over the 21st Century, this is an additional sea-level rise of -6 to 27 cm. Sources: Zervas (2001), Church et al. (2004) Source – Ray Najjar
Potential Impacts to Water Supply and Infrastructure • Prolonged Droughts – Storage? • More ET - Increased Irrigation? • Stormwater system re-vamps? • Sea Level Rise - Salinity Pushing Inland • Infrastructure placement - Water Lines, Sewer Lines, Wastewater Treatment • Loss Of Snow Pack
Water Intakes at Risk from Drought and Sea Level Rise: location of the salt line at high tide during drought • Power • Exelon Delaware Generating Station • Exelon Richmond Generating Station • Philadelphia Gas Works Richmond • Industrial • Koch Material Co. • NGC Industries • Rohm and Haas Philadelphia • MacAndrew and Forbes Co. • Pennwalt Corporation • Sunoco • Public Supply • Torresdale Water Intake (provides • almost 60% of Philadelphia’s water supply) • New Jersey American Water Co. Tri-County Water Treatment Plant
Special Protection Waters Antidegradation program in place to protect the existing high quality waters in the non-tidal River and headwaters…but
Vulnerability of Headwaters • the most sensitive areas of a watershed • Existing contiguous forest is critical to water quantity and quality • Multiple stressors • Increasing development & impervious cover • Road cuts, pipeline connections, • Forest Fragmentation • Philadelphia Source Water Protection Analysis • #1 threat:Change in Delaware River Headwaters 15 Million People +
“Adaptation to climate change is now inevitable… The only question is will it be by plan or by chaos?” Roger Jones, CSIRO, Australia; Co-author of IPCC
Time to Plan & Take Action • Partnerships, multiple agencies and stakeholders • Holistic Analysis – • Geography – basinwide • Water quality, quantity, biological/habitat, human needs • Informed decision makers – risks and options
Develop Informed Options • Sophisticated models & scenario testing • Test drought mitigation plans: drought and flood (of Record ?) • Evaluate effects of reservoir ops on downstream flooding • Evaluate effect of land use change on stream flows • Analysis / Options based on Potential Risk • What infrastructure is at risk? • Relative costs/benefits/potential of adapting in place vs. moving.
Develop Informed Options • Overlay Climate Change on other water resource stressors • Increasing demand – potable supply, power generation, irrigation • Land use change: increased impervious cover, loss of forests,etc. • Evaluate Adaptation Options • Reduce Demand - Water Conservation - System Efficiency • Better Stormwater Management • Need for Increased Upstream Storage (?) • Flood Mitigation – move or protect?
ASSESSMENT Water Availability 2030 Withdrawal Demand Instream Flow Needs (ecological / salinity) Drought Vulnerability Flood Vulnerability GOAL: Determine basin-wide concerns, identify location and magnitude of deficits for vulnerable watersheds and river points STRATEGIES Reduction of Demand by Conservation Measures Conservation pricing, drip irrigation, residential irrigation alternatives, water loss control, plumbing requirements, water reuse, education, etc. Increasing Instream Flow / Mitigating Flood Loss Local solutions, LID, riverine buffers, protection of headwaters, stormwater infiltration, storage in old quarries/ mine rec., ASR New / Modified Storage & Infrastructure Water storage / flood mitigation / Interconnections
Extent of Marcellus Shale Formation within the Delaware River Basin 36% (4,937 mi2) of the Delaware Basin is underlain by the Marcellus Shale
Hydro-fracking Phase – (a week or two) Injection pumps, supplies, and many frack tanks for fresh and flowback waters
Other Stressors in the Basin • Increasing impervious surfaces • Changing demographics/ water demand – • Population size and location • Threats to the Headwaters • Quantity and Quality