Download
1 / 18
180 likes | 212 Vues
Learn about cost modeling, estimating methodologies, data collection, and analysis; uncover cost drivers, technology impact, and analogical systems in predictive modeling.

E N D
Introduction • What makes a good cost model? • Good Statistics • Quality Data • Relevant Data • Analogous or Applicable Data • “Causality” between independent and dependent variables
The Cost Estimating Process • Estimates are always based on history…otherwise, they are mere guesses. History (Data) Predict Future Tools • We use the tools to make the historical data look as much as possible like the future system.
LCCE Process Identify Data Sources & Collect Data Understand the Assignment • Define the Scope • Cost Element Structure • Life Cycle Duration Generate Final Documentation / Presentation Determine Cost Estimating Methodologies Develop & DocumentLCC Elements Perform Sensitivity Analysis
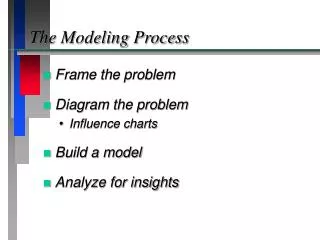
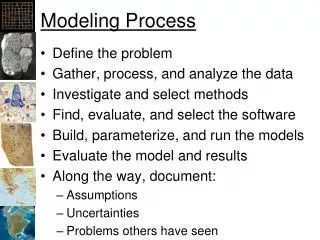
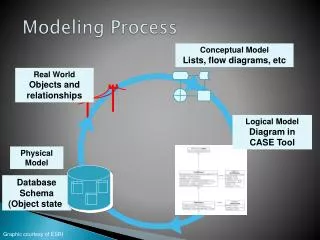
The Modeling Process • Identification of potential cost drivers • Specification of functional forms • Selection of analogous systems • Data Collection • Data Normalization
Identification • Determine what “causes” cost for each cost element • Question experts from government and industry • Identify major cost drivers • Technology • Size • Performance
Cost Drivers • Technology • New, high risk technology is generally more expensive than existing technology • Difficult to capture • Size • Generally, the bigger, the more expensive • Easy to capture • Performance • The greater the performance, the higher the cost • Also easy to capture
Specification • Determination of functional form • The functional form must make sense • Avoid letting the data determine the shape of the line (unless you have a lot of it) • Get engineering opinions if possible • Remember the goal is to obtain good predictions, not good statistics • Make sure cost behaves as expected when the cost driver varies
Specification Increasing at a steady rate Decreasing at a steady rate Increasing at a decreasing rate Decreasing at a decreasing rate Increasing at an increasing rate Decreasing at an increasing rate
Selecting Analogous Systems • Ideally, we would like systems that smell, taste and look like the items we will be estimating • In reality, DoD has few systems which employ similar technology, performance and size • In general, do not overly constrain yourself when selecting analogous tasks • In order to be called “analogous” the system need only have a similar cost driver and a similar functional form when mapped to cost
Collecting Data • Select systems relevant to system being costed • Choose analogous systems or components based upon elements identified/defined in WBS • Typical cost drivers include physical and performance characteristics • physical characteristics: weight, volume, number of holes drilled, number of parts to assemble, materials of composition, etc. • performance characteristics: power, thrust, bandwidth, range, speed, etc. • Improvements in technology are an extremely important consideration • measures of technology include: % composite material, radar cross section, etc.
Collecting Data • Identify relevant historical cost, technical, and programmatic data to be collected • Program schedule, development quantity, production quantity • Physical and performance data from operating (NATOPS) manuals, manufacturer’s specifications, test data
Data Sources • Data sources include any or all of the following: contractor accounting records, contractor cost data reports (CCDR), cost performance reports (CPR), cost/schedule status reports (C/SSR), cost proposals/bids, or other sources within industry and government • Common denominator is contractor
Data Analysis • Review data collected to insure homogeneity (i.e., standard quantities, constant $), adequate coverage of all WBS elements, consistency with proposed system complexity • Allocate data to WBS elements • Organize data on a consistent basis (system to system, contractor to contractor, WBS element to WBS element) • Ideally would like to distinguish between recurring and non-recurring costs, support costs, direct and indirect costs, profit • Identify problems and anomalies with the data • Gaps in data, jumps in technology, type of program (design to cost vs. other), major failures in development/testing phase, strike by work force, etc.
Data Analysis • Normalize the data as necessary • Consistent units/elements of cost • Adjust for inflation • Develop learning curve to adjust for quantity differences • 1st unit cost • Account for absent cost items, remove inapplicable cost items
Develop Cost Estimate • Four common approaches to developing a Cost Estimating Relationship (CER) • Analogy • Engineering cost estimate • Expert opinion • Statistical/parametric approach