Download
1 / 20
210 likes | 441 Vues
Detonation and Detonation-Driven Tube Fracture. Joe Shepherd, Aeronautics, Caltech. Personnel Faculty: J. E. Shepherd A. Khokhlov (U Chicago) J. Austin (UIUC) Staff Scientists: F. Cirak R. Deiterding P. Hung

E N D
Detonation and Detonation-Driven Tube Fracture Joe Shepherd, Aeronautics, Caltech Personnel Faculty: J. E. Shepherd A. Khokhlov (U Chicago) J. Austin (UIUC) Staff Scientists: F. Cirak R. Deiterding P. Hung M. Arienti (-> UTRC May 2004) Graduate Students: T.-W. Chao (PhD March 2004) F. Pintgen S. Browne FY04 Review October 19-20, 2004
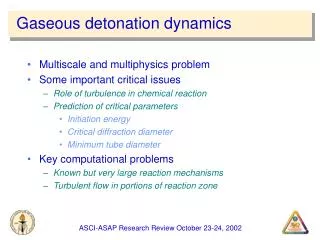
Structure of Detonations Simulation Experiment Regular Irregular Poster
Connection with VTF Three connections: • Detonation wave propagation, structure of the front • Requires AMR, reduced chemistry, turbulence modeling • Dynamic fracture, plastic deformation • Multiscale modeling, advanced FEM methods (shells) • Coupled fluid-solid problem • Benchmark problem for VTF techniques • Strong coupling of solid and fluid motion • Multiple interpretations: • Engineering models for material response and detonation with the focus on the coupling between fluid and solids. • Research multiscale models of individual processes, i.e., detonation, fracture propagation, plasticity, etc.
Validation Aspects • Models that are being tested: • Dynamic fracture, contact, plastic deformation • Compressible, reacting, turbulent flow: detonation • Integrated simulations, fluid-structure interaction • Measurements that are being performed: • Strain History • Crack speeds • Digitized crack paths • Pressure (detonation and post-rupture blast) • Detonation front structure: • Wave shape • Density (schlieren) • OH concentration measurements • Precisely controlled initial conditions and boundary conditions
Previous work: 2002-2003 • Elastic wave propagation driven by detonations • Shear-wave resonance study • Detonation-driven fracture in Al tubes (6061T6) • No prestress control • Effect of initial crack length studied • Crack bifurcation and curving observations • Fractography • Fracture threshold model • Comparison of static and dynamic fracture
Progress: Oct 2003 – Oct 2004 • Fracture experiment series completed in new facility (T.-W. Chao) • 36 experiments accurately controlling prestress • Measurements: • Strain • Crack paths • Blast pressure • Crack Speeds • Visualization of initial crack opening • Validation of elastic wave propagation (F. Cirak) • Diffraction experiments (F. Pintgen, R. Deiterding, P. Hung) • 100+ experiments completed with two mixtures – weakly and strongly unstable • Measurements • OH PLIF and schlieren • Multiple exposure luminosity • Stereoscopic imaging and 3D reconstruction • Analysis of role of diffusion in detonations (M. Arienti) • Examination of 3-step models for detonation chemistry (S. Browne)
Validation of elastic wave propagation Measured Hoop Strain and Detonation Pressure Comparison of Measured Hoop strain and Simulation (resolution study)
Issues in validation • Simulation amplitude about 20% higher than experiment • Parametric examination of possible sources of error: • Resolution (number of shell elements) • Eccentricity and thickness variations of tube • Wave speed • Pressure decay rate • Detonation structure • Systematic error in experiment • Frequency response of strain gauges • Nonsteady detonation wave Poster
Using Prestress to Control Crack Propagation Path Test Fixture Design criteria: • Compliance of the fixture is orders of magnitude lower than that of the specimen • Minimize bending due to misalignment • Precisely prescribe torque to control crack propagation path Detonation direction Test Matrix (36 shots): • Pressure series • Torsion series • Crack length series • Repeat series
Incipient Crack Kinking Detonation Direction Initial Notch Hoop Stress Shear Stress Hoop Stress Shear Stress Torque Direction (right-hand rule) Initial Notch Image from Shot 153 Kinked Incipient Forward and Backward Cracks
Effect of Reflected Shear Wave: Crack Path Direction Reversal • Cracks initially kinked at angles consistent with principal stresses • The cracks then reversed directions due to reflected shear waves • Shear wave travel time: 150 ms Shot 143
Effect of Reflected Shear Wave: Crack Path Direction Reversal Shear Strain Reversal Rosette 1 (solid) Rosette 2 (dotted) Detonation Wave Direction
High-Speed Video Visualization Shot 148 Shot 147 Shot 146 Poster
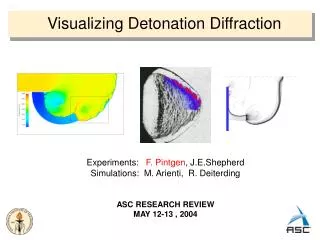
Detonation Diffraction • complex flow field-especially in critical regime • short time scales • two mixture types studiedin criticalregime accoustic corner disturbance signal t4 t3 t1 t2 D UCJ diffracting shock
Optical Diagnostics Simultaneous use of: • Schlieren system • PLIF system to detect OH radical distribution • Multiple exposure chemiluminescence • imaging
Qualitative comparison with simulation sub-critical reignition event 2H2+O2+70%Ar 10kPa, D/l=12 2H2+O2+70%Ar 10kPa, D/l=8 R. Deiterding, (AMROC) flow direction PLIF - schlieren overlay 2H2 +O2+22%N2 , 100kPa, D/l=13 detonation wave traveling into shocked but unreacted fluid image-height 130mm OH PLIF Poster 2H2+O2+70%Ar, 100kPa, D/l=12
Quantitative differences in mixture type low activation energy, q=4.8 high activation energy, q=9.5 Measurements of reaction front velocity from multiple exposure chemiluminescence images 2H2+O2+67%Ar, 100kPa
Further measurements • Shape of shock • front in sub-critical • case q=4.8 q=9.5 • velocity of shock on center line and along wall • induction zone length on center line and wall (from PLIF-schlieren overlays) • 3-dimensional image construction for re-ignition event 2H2+O2+67%Ar, 100kPa
Summary • Fracture: • Experimental data base available for validation testing • http://www.galcit.caltech.edu/~tongc/ • Detonation: • Experimental database on detonation structure available • Diffraction experiments completed • PLIF and schlieren images available for validation of AMR • Analysis of chemistry and diffusion in progress • 3-step model for treating competition effects • Preliminary shear layer ignition modeling • Future work • Higher resolution and precision strain measurements • Combined effects experiments • Simultaneous imaging of blast waves and fracture