Statistics for Microarrays
Statistics for Microarrays. Cluster Analysis. Class web site: http://statwww.epfl.ch/davison/teaching/Microarrays/ETHZ/. Biological question Differentially expressed genes Sample class prediction etc. Experimental design. Microarray experiment. 16-bit TIFF files. Image analysis.

Statistics for Microarrays
E N D
Presentation Transcript
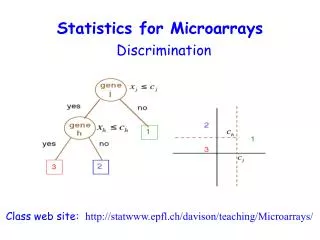
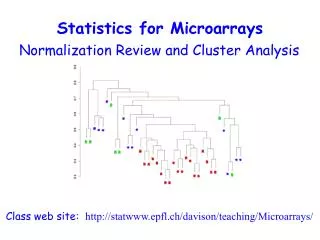
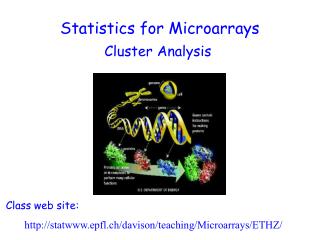
Statistics for Microarrays Cluster Analysis Class web site: http://statwww.epfl.ch/davison/teaching/Microarrays/ETHZ/
Biological question Differentially expressed genes Sample class prediction etc. Experimental design Microarray experiment 16-bit TIFF files Image analysis (Rfg, Rbg), (Gfg, Gbg) Normalization R, G Estimation Testing Clustering Discrimination Biological verification and interpretation
cDNA gene expression data mRNA samples Data on p genes for n samples sample1 sample2 sample3 sample4 sample5 … 1 0.46 0.30 0.80 1.51 0.90 ... 2 -0.10 0.49 0.24 0.06 0.46 ... 3 0.15 0.74 0.04 0.10 0.20 ... 4 -0.45 -1.03 -0.79 -0.56 -0.32 ... 5 -0.06 1.06 1.35 1.09 -1.09 ... Genes Gene expression level of gene i in mRNA samplej = (normalized) Log(Red intensity / Green intensity)
Cluster analysis • Used to find groups of objects when not already known • “Unsupervised learning” • Associated with each object is a set of measurements (the feature vector) • Aim is to identify groups of similar objects on the basis of the observed measurements
Clustering Gene Expression Data • Can cluster genes (rows), e.g. to (attempt to) identify groups of co-regulated genes • Can cluster samples (columns), e.g. to identify tumors based on profiles • Can cluster both rows and columns at the same time
Clustering Gene Expression Data • Leads to readily interpretable figures • Can be helpful for identifying patterns in time or space • Useful (essential?) when seeking new subclasses of samples • Can be used for exploratory purposes
Similarity • Similarity sij indicates the strength of relationship between two objects i and j • Usually 0 ≤ sij ≤1 • Correlation-based similarity ranges from –1 to 1
Dissimilarity and Distance • Associated withsimilarity measures sij bounded by 0 and 1 is a dissimilarity dij = 1 - sij • Distance measures have the metric property (dij +dik ≥ djk) • Many examples: Euclidean, Manhattan, etc. • Distance measure has a large effect on performance • Behavior of distance measure related to scale of measurement
Partitioning Methods • Partition the objects into a prespecified number of groups K • Iteratively reallocate objects to clusters until some criterion is met (e.g. minimize within cluster sums of squares) • Examples: k-means, partitioning around medoids (PAM), self-organizing maps (SOM), model-based clustering
Hierarchical Clustering • Produce a dendrogram • Avoid prespecification of the number of clusters K • The tree can be built in two distinct ways: • Bottom-up: agglomerative clustering • Top-down: divisive clustering
Agglomerative Methods • Start with n mRNA sample (or p gene) clusters • At each step, merge the two closest clusters using a measure of between-cluster dissimilarity which reflects the shape of the clusters • Examples of between-cluster dissimilarities: • Unweighted Pair Group Method with Arithmetic Mean (UPGMA): average of pairwise dissimilarities • Single-link (NN): minimum of pairwise dissimilarities • Complete-link (FN): maximum of pairwise dissimilarities
Divisive Methods • Start with only one cluster • At each step, split clusters into two parts • Advantage: Obtain the main structure of the data (i.e. focus on upper levels of dendrogram) • Disadvantage: Computational difficulties when considering all possible divisions into two groups
Partitioning vs. Hierarchical • Partitioning • Advantage: Provides clusters that satisfy some optimality criterion (approximately) • Disadvantages: Need initial K, long computation time • Hierarchical • Advantage: Fast computation (agglomerative) • Disadvantages: Rigid, cannot correct later for erroneous decisions made earlier
Generic Clustering Tasks • Estimating number of clusters • Assigning each object to a cluster • Assessing strength/confidence of cluster assignments for individual objects • Assessing cluster homogeneity
Bittner et al. It has been proposed (by many) that a cancer taxonomy can be identified from gene expression experiments.
Dataset description • 31 melanomas (from a variety of tissues/cell lines) • 7 controls • 8150 cDNAs • 6971 unique genes • 3613 genes ‘strongly detected’
Average linkage hierarchical clustering, melanoma only 1-r = .54 unclustered ‘cluster’
Issues in Clustering • Pre-processing (Image analysis and Normalization) • Which genes (variables) are used • Which samples are used • Which distance measure is used • Which algorithm is applied • How to decide the number of clusters K
Issues in Clustering • Pre-processing (Image analysis and Normalization) • Which genes (variables) are used • Which samples are used • Which distance measure is used • Which algorithm is applied • How to decide the number of clusters K
Filtering Genes • All genes (i.e. don’t filter any) • At least k (or a proportion p) of the samples must have expression values larger than some specified amount, A • Genes showing “sufficient” variation • a gap of size A in the central portion of the data • a interquartile range of at least B • Filter based on statistical comparison • t-test • ANOVA • Cox model, etc.
Issues in Clustering • Pre-processing (Image analysis and Normalization) • Which genes (variables) are used • Which samples are used • Which distance measure is used • Which algorithm is applied • How to decide the number of clusters K
Average linkage hierarchical clustering, melanoma only unclustered ‘cluster’
Average linkage hierarchical clustering, melanoma & controls unclustered ‘cluster’ control
Issues in clustering • Pre-processing • Which genes (variables) are used • Which samples are used • Which distance measure is used • Which algorithm is applied • How to decide the number of clusters K
Issues in clustering • Pre-processing • Which genes (variables) are used • Which samples are used • Which distance measure is used • Which algorithm is applied • How to decide the number of clusters K
Issues in clustering • Pre-processing • Which genes (variables) are used • Which samples are used • Which distance measure is used • Which algorithm is applied • How to decide the number of clusters K
How many clusters K? • Many suggestions for how to decide this! • Milligan and Cooper (Psychometrika 50:159-179, 1985) studied 30 methods • Some new methods include GAP (Tibshirani ) and clest (Fridlyand and Dudoit) • Applying several methods yielded estimates of K = 2 (largest cluster has 27 members) to K = 8 (largest cluster has 19 members)
Average linkage hierarchical clustering, melanoma only unclustered cluster
Summary • ‘Buyer beware’ – results of cluster analysis should be treated with GREAT CAUTION and ATTENTION TO SPECIFICS, because… • Many things can vary in a cluster analysis • If covariates/group labels are known, then clustering is usually inefficient
IPAM Group, UCLA: Debashis Ghosh Erin Conlon Dirk Holste Steve Horvath Lei Li Henry Lu Eduardo Neves Marcia Salzano Xianghong Zhao Others: Sandrine Dudoit Jane Fridlyand Jose Correa Terry Speed William Lemon Fred Wright Acknowledgements