Demographic impacts on elderly support
140 likes | 286 Vues
Demographic impacts on elderly support. Guo Zhigang Department of Sociology, Peking University, 100871, China zguo@pku.edu.cn. Change in mean size of household. Decomposing the Change of mean size of household. 1982-1990: MS= 4.41-3.96= 0.45, MC= 1.48-1.10= 0.38 (85.5%)

Demographic impacts on elderly support
E N D
Presentation Transcript
Demographic impacts on elderly support Guo Zhigang Department of Sociology, Peking University, 100871, China zguo@pku.edu.cn
Decomposing the Change of mean size of household 1982-1990: MS=4.41-3.96= 0.45, MC=1.48-1.10= 0.38 (85.5%) 1990-2000: MS=3.96-3.44= 0.52, MC=1.10-0.79= 0.31 (59.4%)
Population by age by HH type 3-generation 2-generation Couple Single
Figure 4 Inter-generational net wealth flow by residence and age group: 1992 The elderly and the Family in China
Table 8 Population Distribution by Policy Implemented Implications by fertlility policy Table 9 Distribution of Couples according to Fertility Policies
Table 10 Average Policy Fertility Level Fertility by the policies • Note: West 2 stands for the calculation for the west region without Chongqin municipality and Sichuan province, where one child policy is implemented.
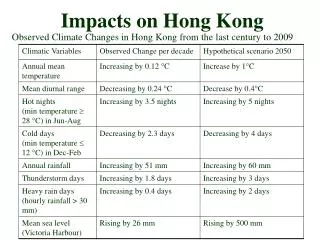
Table 11 China’s population age structure Population Ageing