Download
1 / 25
250 likes | 285 Vues
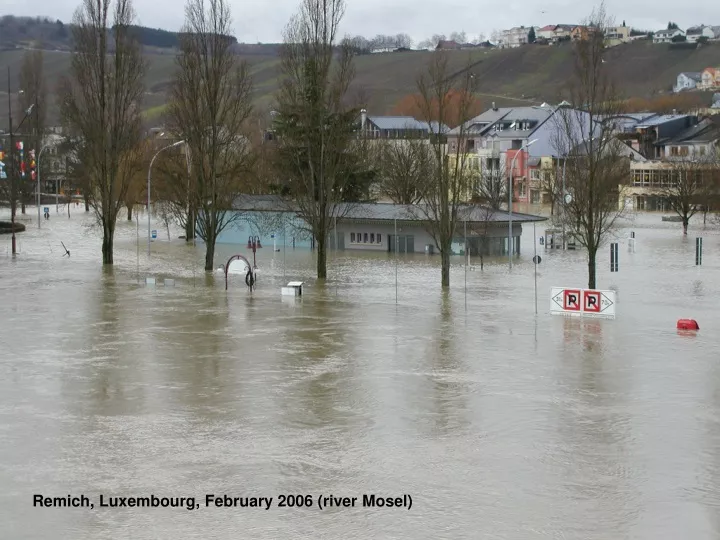
Remich, Luxembourg, February 2006 (river Mosel). Cross border flood hazard maps – Experiences from the TIMIS flood project. Thematic Workshop on Flood Mapping, Dublin, September 17-19, 2008.

E N D
Cross border flood hazard maps – Experiences from the TIMIS flood project Thematic Workshop on Flood Mapping, Dublin, September 17-19, 2008 Juerg ELSENER METZ, Deputy Project CoordinatorErnst Basler + Partner AG, Zollikon, Switzerland, juerg.elsener@ebp.ch http://www.timisflood.net
Table of content • Project overview • Products available as of 2009 • Generation of hazard maps • Transnational issues: Challenges and strategies • Conclusions and findings
Project overview: Facts and figures flood hazard maps improvement of forecast for the river Mosel warning system for small catchment areas 6.86 million € 50% funded by the INTERREG IIIB NWE programme 7 partners from Luxembourg (lead), France and Germany 2004 to 2008
Project area and project partners Project partners Forecast and Warning Hazard Maps
1 Project management and communication activities 2 Data collection 4 Hazard maps and GIS 3 Forecast and warning system 5 Transnational information system Actions
Project schedule Management and Communication Data acquisition Data modelling Product generation Dissemination Today Closing Conference: October 20, 2008, Mertert-Wasserbillig, Luxembourg
Products available 2009: Maps and Web services Transnational hazard maps
Products available 2009: Maps and Web services Transnational forecast and warning system
Products available 2009: Maps and Web services Transnational WebGIS application on flooding
Products available 2009: Maps and Web services Web service: Print-on-Demand
Products available 2009: Maps and Web services Web service: Platform for information exchange, PLATIN MS
Products available 2009: Maps and Web services Web service: RSS feed
Generation of hazard maps • Base Maps • Laserscanning / Digital terrain model (DTM) • Surveying of river cross-sections • Hydraulic modelling • Hazard classification and hazard stages
National maps: 1:5’000, 1:20’000/25’000, 1:50’000, 1:100’000 Transnational maps (Cartosphere): 1:250’000, 1:500’000, 1:1 Mio. colour transformed into gray values projection: «on-the-fly» from original to the desired projection Base Maps
airborne laserscanning in winter (no vegetation) density: 1-2 points per m2 elevation accuracy: ± 0.17 m, football fields as control areas classification terrain-surface: semi-automatic Processing of the digital terrain model (DTM) Laserscanning of elevation points, DTM
field surveying (tachymetry) parameters: elevation, hydrological parameters (roughness, vegetation) every 100 – 200 meters elevation accuracy: 0.01 mpositional accuracy: 0.20 m georeferenced photos of obstacles (bridges, weirs) Surveying of river cross-sections
1d-modelling (90% of rivers);2d-modelling (10% of rivers) 10 flood events representing 10 different probabilities of occurrence (from MHQ*0.1 to HQextreme) representative run-offs: gauge level statistics, regionalisation, statistical analysis water levels, water depth, flow velocity Hydraulic Modelling
hazard classification by intensity (water depth * flow-velocity) and probability of occurence 4 hazard stages (substantial, moderate, minor, residual) integration of existing hazard maps (France, Interreg IIC projects, Rhineland-Palatinate) Hazard classification and hazard stages
Transnational issues: Challenges and strategies • Data inter-operability • Methods and standards for hazard maps • Organisational aspects
Challenge 1: Data inter-operability • Differences in • acquisition date, updating • scale, representation • acquisition technology, accuracy • cartographic projection • data format, data model • Strategies • managing all the data in geodatabases and in their original projection • collecting meta data for all datasets • using methods which can manage data inhomogeneities
Fliessgeschwindigkeit HQ100 gering mittel hoch Aléa faible Aléa moyen Aléa fort Aléa très fort <50cm 50cm-1m 1m-1.50m 1.50-2m 2m-2.50m 2.50-3m >3m Wassertiefe HQ100 Challenge 2: Methods and standards for hazard maps • Different hazard categories • in Luxembourg and Rhineland-Palatinate (TIMIS flood) • Rhine-Atlas • in France • in Baden-Württemberg • Strategies • Keep and combine the different approaches, set minimal standards • present in maps «common denominator», e.g. water depths HQ100
Hazard maps Risk maps for test areas Forecast and warning (Geo-) data Desktop GIS (information) Internet services Interested public Concerned inhabitants Municipalities Civil protection and intervention services Water authorities Spatial planning authorities (Re-) Insurance companies Researchers and experts Challenge 3: Organisational aspects • Transnational stakeholders have different • requirements and interests • knowledge and competences • cultures and mentalities • Strategies • communication plan, incl. stakeholder analysis • activities such as website, newsletters, multi-lingual glossary, web-based workspace • workshops with relevant stakeholders • present and discuss prototypes with potential users
Conclusions and findings • address all responsible authorities, even if they’re not project partners • consider comparable accuracy and method standards for hazard maps • define minimal data models which can be extended to national requirements • promote hazard maps actively down to the affected citizens • exchange knowledge with other transnational projects dealing with flooding A Set of minimal common standards is required to afford cooperation and to ensure efficiency
http://www.timisflood.net Thank you very much for your attention !