Download

1 / 25
260 likes | 482 Vues
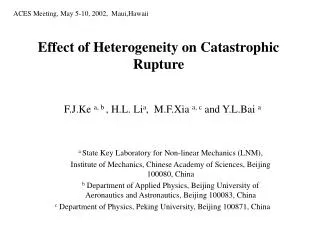
Effects of heterogeneity of dispersions on multivariate distance-based permutation tests. Marti Anderson 1 & Daniel Walsh 2. 1 New Zealand Institute for Advanced Study (NZIAS). 2 Institute of Information and Mathematical Sciences (IIMS). Massey University, Albany Campus, Auckland.

E N D
Effects of heterogeneity of dispersions on multivariatedistance-based permutation tests Marti Anderson1 & Daniel Walsh2 1New Zealand Institute for Advanced Study (NZIAS) 2Institute of Information and Mathematical Sciences (IIMS) Massey University, Albany Campus, Auckland
Consider a set of p-dimensional multivariate data, with N sample units divided into g groups... ... and a derived matrix of distances among the N sample units 1 2 3 ... N 1 2 3 ... p 1 Y 1 2 2 3 3 ... ... D N N
Methods to be compared • Classical MANOVA H0: m1 = m2 • Assumes homogeneity of dispersions: S1 = S2 • Actually a two-part null hypothesis (Fisher) • Multivariate distance-based permutation methods H0:“no differences among groups” • Mantel (1967) [no. citations = 4,470] • ANOSIM (Clarke 1993) [no. citations = 3,004] • PERMANOVA (McArdle & Anderson 2001; Anderson 2001) [no. citations = 494 and 1,045] • Although differences among centroids (location) are generally of interest, sensitivity to other kinds of differences (e.g., dispersions, skewness, etc.) is unknown.
Group 1 Group 2 ANOSIM First transform the distances to ranks (smallest distance = 1) Group 1 Group 2 Distance matrix Mantel Equivalent to ANOSIM without the ranking, e.g. PERMANOVA Pillai’s trace SSCP matrices
Simulation study • Empirical measures of effects of heterogeneity on rejection rates under a variety of known scenarios: • Error distribution: MVN and non-normal (Poisson, NB) • Total sample size (balanced and unbalanced) • Degree of imbalance (effects of ↑ dispersion in group with smaller vs. larger sample size) • Degree and nature of correlation structure among variables • H0: m1 = m2 is true (Type I error), or false (Power) • Distance measure used (Euclidean, Bray-Curtis, etc.) • Number of groups • Number of variables We’ll stick with Euclidean distances here...
Simulations, cont’d • Under each scenario, we simulated 1000 datasets and performed four tests on each one: • ANOSIM, MANTEL, PERMANOVA, with p-values from 999 random permutations. • Pillai’s trace (classical MANOVA), with p-values estimated from the usual F-distribution • When H0: m1 = m2 is true, we expect uniform distributions of p-values for any given method that is performing well, and the expected proportion of rejections (i.e. p-values ≤ 0.05) is 0.05 (with binomial 95% CI of 0.038 – 0.066). • Power may only be relevant for methods where Type I error is intact (at nominal a-level).
To introduce greater heterogeneity, gradually increase m... Multivariate normal m = 2 m = 1 m = 10 m = 5 e.g.,
Equal sample sizes per group, MVN, p = 2, g = 2, homogeneity (m = 1) 1.0 So far, so good... 0.8 ANOSIM Mantel 0.6 PERMANOVA Pillai’s trace Rejection rate (a = 0.05) 0.4 0.2 0.05 0 n = 4 n = 6 n = 9 n = 12 n = 18 n = 24 5 10 15 20 25 30 35 40 45 50 Total sample size (n1 + n2)
Equal sample sizes per group, MVN, p = 2, g = 2, heterogeneity (m = 2) 1.0 ANOSIM and Mantel start to crack up... 0.8 Gets worse with increasing N. ANOSIM Mantel 0.6 PERMANOVA Pillai’s trace Rejection rate (a = 0.05) 0.4 0.2 0.05 0 n = 4 n = 6 n = 9 n = 12 n = 18 n = 24 5 10 15 20 25 30 35 40 45 50 Total sample size (n1 + n2)
Equal sample sizes per group, MVN, p = 2, g = 2, heterogeneity (m = 5) 1.0 0.8 ANOSIM Mantel 0.6 PERMANOVA Pillai’s trace Rejection rate (a = 0.05) 0.4 0.2 0.05 0 n = 4 n = 6 n = 9 n = 12 n = 18 n = 24 5 10 15 20 25 30 35 40 45 50 Total sample size (n1 + n2)
Equal sample sizes per group, MVN, p = 2, g = 2, heterogeneity (m = 10) 1.0 0.8 ANOSIM Mantel 0.6 PERMANOVA ANOSIM and Mantel reject H0 more often than not. Pillai’s trace Rejection rate (a = 0.05) A type of power? 0.4 Very hard to rock the boat for PERMANOVA or Pillai... 0.2 0.05 0 n = 4 n = 6 n = 9 n = 12 n = 18 n = 24 5 10 15 20 25 30 35 40 45 50 Total sample size (n1 + n2)
How about for unbalanced data? Two scenarios (p = 2, g = 2, MVN, r = 0): Smaller group has greater dispersion Larger group has greater dispersion
Unequal sample sizes, smaller group has greater dispersion (n1 < n2), MVN, p = 2, g = 2 n2 / n1 = 2 n2 / n1 = 3 n2 / n1 = 5 1.0 m = 0.5 Increasing disparity in sample size 0.8 0.6 0.4 ANOSIM 0.2 Mantel PERMANOVA 0.05 0 Pillai’s trace Rejection rate (a = 0.05) 1.0 m = 0.2 0.8 0.6 0.4 0.2 0.05 0 10 20 30 40 50 10 20 30 40 50 10 20 30 40 50 Total sample size (n1 + n2) PERMANOVA and Pillai’s trace start to misbehave too... But rejection rate is constant for a given sample-size ratio...
Unequal sample sizes, larger group has greater dispersion (n1 < n2), MVN, p = 2, g = 2 n2 / n1 = 2 n2 / n1 = 3 n2 / n1 = 5 m = 2 Increasing disparity in sample size 0.05 ANOSIM Mantel PERMANOVA 0 Pillai’s trace Rejection rate (a = 0.05) m = 5 0.05 0 10 20 30 40 50 10 20 30 40 50 10 20 30 40 50 Total sample size (n1 + n2) More severe with ANOSIM and Mantel Conservatism!
Ooohhh.... There are soooo many ways that H0 can be false....! What about power? • Show a few targeted simulations • MVN • Larger number of variables (p = 5); the means gradually shift for all variables. • High correlation structure among all but one variable, and only this one is changing in its mean.
MVN, p = 5, g = 2, n1 = n2 = 24, homogeneity (m = 1) , all correlations = 0 1.0 0.8 ANOSIM Mantel 0.6 PERMANOVA Pillai’s trace Rejection rate (a = 0.05) 0.4 0.2 0 0.0 0.5 1.0 1.5 2.0 2.5 Difference in means (in units of the sd of the means for group 1)
MVN, p = 5, g = 2, n1 = n2 = 24, homogeneity (m = 1) , 4 variables have correlations = 0.9 One independent variable has a changing mean. MVN, p = 5, g = 2, n1 = n2 = 24, m = 1 1.0 0.8 ANOSIM Mantel 0.6 PERMANOVA Pillai’s trace Rejection rate (a = 0.05) 0.4 0.2 0 0.0 0.5 1.0 1.5 2.0 2.5 Difference in means (in units of the sd of the means for group 1)
Ooohhh.... There are soooo many ways that H0 can be false....! What about power? • Show a few targeted simulations • MVN • Larger number of variables (p = 5), the means gradually shift for all variables. • High correlation structure among all but one variable, and only this one is changing in its mean. • Negative Binomial ( ) • Dispersion parameter q = 0 as m shifts (Poisson). • Dispersion parameter q = 0.4 remains constant as m shifts. • Dispersion parameter q differs between groups as well.
Poisson, p = 2, g = 2, n1 = n2 = 24, (NB with q = 0 for both groups). 1.0 0.8 ANOSIM Mantel 0.6 PERMANOVA Pillai’s trace Rejection rate (a = 0.05) 0.4 0.2 0 0.0 0.5 1.0 1.5 2.0 2.5 Difference in means (in units of the sd of the means for group 1)
Negative binomial, p = 2, g = 2, n1 = n2 = 24, (q = 0.4 for both groups). 1.0 0.8 ANOSIM Mantel 0.6 PERMANOVA Pillai’s trace Rejection rate (a = 0.05) 0.4 0.2 0 0.0 0.5 1.0 1.5 2.0 2.5 Difference in means (in units of the sd of the means for group 1)
Negative binomial, p = 2, g = 2, n1 = n2 = 24, (q = 0 for group 1, q = 0.4 for group 2). 1.0 0.8 ANOSIM Mantel 0.6 PERMANOVA Pillai’s trace Rejection rate (a = 0.05) 0.4 0.2 0 0.0 0.5 1.0 1.5 2.0 2.5 Difference in means (in units of the sd of the means for group 1)
Summary • ANOSIM and Mantel tests are much more sensitive to heterogeneity in dispersions than either PERMANOVA or Pillai’s trace. • PERMANOVA and Pillai’s trace are quite robust for MVN data in balanced designs. • All tests were sensitive to heterogeneity for unbalanced designs. • Inflated Type I error when large dispersion occurred in the small group; • Overly conservative when large dispersion occurred in the large group. • PERMANOVA and Pillai’s trace had constant rejection rates for a given degree of heterogeneity and sample-size ratio. • ANOSIM cannot, however, be used routinely as an omnibus test, due to rampant conservatism for some unbalanced scenarios.
Summary, cont’d • Power is tricky... For MVN data: • PERMANOVA is more powerful when many uncorrelated variables are all changing simultaneously. • Pillai’s trace is more powerful when changes are happening in only one dimension, orthogonal to other highly correlated variables that are not changing. • For Non-normal data: • PERMANOVA > Mantel > Pillai > ANOSIM for Poisson or NB distributed data where q was constant. • If q was not constant, then ANOSIM and Mantel had inflated type I error, whereas PERMANOVA did not and was also more powerful than Pillai’s trace.
Further results... work in progress • Effects of heterogeneity across different numbers of groups and for increasing numbers of variables. • A greater number of scenarios for power • Realistic simulations (overparameterised and mixed distributions of multivariate count data) • Further consideration of intrinsic mean-variance relationships • Effects of using different distance measures
We wish to thank... The Royal Society of New Zealand, Marsden Grant MAU1005 Our UK Colleagues, K. R. Clarke and Ray Gorley, of PRIMER-e Our colleagues in the NZ Institute for Advanced Study Anil Malhotra, Mike Yap and Yan Ou for computing support at IIMS Our colleagues in Statistics at Massey University Albany: (especially Beatrix Jones, Mat Pawley, Katharina Parry, Adam Smith and Olly Hannaford)