Download
1 / 30
300 likes | 336 Vues
Explore predictability concepts in weather and climate, from phase space to coupled atmosphere-ocean systems, using models and statistics. Learn about ensemble forecasting and predicting future states with an emphasis on climate response.

E N D
8. Seasonal-to-Interannual Predictability and Prediction 8.1 Predictability 8.2 Prediction
8.1 Predictability (see handout from Rowan Sutton) • “If we claim to understand the climate system surely we should be able to predict it!” • If we cannot predict the atmosphere is this because our understanding is inadequate or are there deeper reasons? • The study of predictability concerns the systematic investigation of the extent to which it is possible to predict a system • Active area of research in weather and climate
8.1.1 Basic Concepts Phase space The state of any physical system can be uniquely defined by giving the values of some set of variables e.g. pendulum is defined uniquely by its angle from the vertical and its angular velocity
Phase space 1.0 0.0 -1.0 0.0 1.0 -1.0
Undamped Pendulum Phase space trajectory 1.0 0.0 -1.0 0.0 1.0 -1.0
1.0 0.0 Small error in initial condition -1.0 0.0 1.0 -1.0
1.0 0.0 Small error in prediction -1.0 0.0 1.0 -1.0
8.1.1 Basic Concepts How do errors evolve in time? How rapidly do phase space trajectories diverge? If diverge very slowly or not at all – then a small error in initial conditions implies a small error in the prediction of the future state – system relatively predictable If trajectories diverge rapidly – system is unpredictable
8.1.1 Basic Concepts Pendulum is an example of a predictable system Two trajectories starting close together tend to stay close together Opposite extreme – are chaotic systems – e.g. atmosphere In these systems errors grow exponentially and thus even in a perfect model they are hard to predict far in advance Such systems have a strong sensitivity to initial conditions
8.1.2 Predictability of the Atmosphere • To make weather forecasts we need at least two things: • knowledge of the state of the atmosphere now • a model that will produce a prediction of the future state • Lets assume that the model is perfect (BIG ASSUMPTION!) • Analyses have errors (big gaps in observing network) • Hence there are many possible initial states consistent with our observations
8.1.2 Predictability of the Atmosphere Recognizing that we cannot pick one state has led to the development of ensemble forecasting Rather than a single forecast we make many forecasts each from slightly different initial conditions (and each equally likely) Spread of forecasts gives us an idea of confidence in forecasts
8.1.3 Predictability of the Second Kind Previous is predictability of the 1st kind – growth of errors in initial value problems such as weather forecasting Initial value problems are not the only sort of prediction in which we are interested Response of climate system to changing levels of greenhouse gases – we do not believe that this will depend on the state of the atmosphere today or tomorrow We wish to know the response of a system to externally imposed forcing - this is predictability of the second kind
8.1.3 Predictability of the Second Kind Need to use statistics to characterise the system (not useful to consider wind at Albany on a particular day) Probability density functions (PDFs) – how will pdf change in response to external forcing?
8.1.3 Predictaility of the Second Kind Probability density functions (PDFs) – how will pdf change in response to external forcing? shift in mean? more variance? greater likelihood of extreme events? See sketches
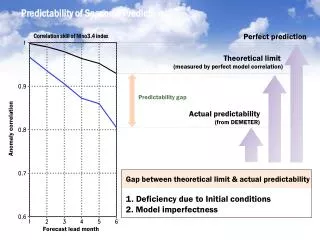
8.1.4 Predictability of the coupled atmosphere-ocean system Weather forecasts – little use after a week or so 1-2 weeks = “predictability horizon” for weather (cf plumes seen earlier) Seasonal Forecasts – exploits the fact that atmosphere is influenced by surface conditions that vary slowly (e.g. SSTs) Possible because “predictability horizon” for the ocean is much longer: months, years and even decades Also possible because the atmosphere strongly responds to SST anomalies – especially in the tropics (Clausius-Clapeyron) predictability can arise in association with persistent soil moisture and snow cover (important for Asian monsoon) too
8.1.4 Predictability of the coupled atmosphere-ocean system Seasonal prediction – is a prediction problem of the first kind in that it is an initial value problem Need a coupled ocean-atmosphere model and an estimate of initial state of ocean as well as atmosphere As before we need to use ensemble techniques using slightly different initial conditions
Plot of SST predictions made at weekly intervals from November 1996. Each forecast is for 6 months . The thick solid curve shows the observed SST anomaly. Although three forecasts are made each week, only one is plotted in order to avoid clutter. The onset of El Nino in April is well predicted by the coupled system. The subsequent evolution is also well forecast, although one can see a tendency to underpredict the amplitude of the event. The vertical axis is the monthly mean SST anomaly in the NINO 3 region, shown in the inset.
This figure shows vertical sections along the equator of the upper 400m of the ocean (Indian , Pacific and Atlantic oceans from left to right). Panel a) shows anomalies for October 1996, b) for January 1997 and c) for April 1997. The propagation and amplification of temperature anomalies from west to east is clearly visible
8.1.4 Predictability of the coupled atmosphere-ocean system Seasonal prediction – is also prediction of the 2nd kind External forcing of atmosphere due to changing SSTs lead to changes in PDFs as before Given the strong atmospheric sensitivity to changes in tropical SSTs means that seasonal forecasts are more useful for the tropics
8.1.5 Some Comments A current research topic relates to how we link seasonal predictions to applications (e.g. water resources, food security, health) Applications require information about statistics rather than the seasonal mean anomaly for example How predictable are weather statistics? Back to considering predictability of PDFs – an understudied area.
8.2 Prediction • (i) Two-Tier Systems • Forecasting SSTs - statistical models and dynamical models • Using SSTs to predict Climate – can force atmospheric model with given SSTs • (ii) Single Tier Systems • Coupled atmosphere-ocean models • (iii) Statistical • Statistical Forecast Models of climate variability • (iv) Consensus • Use all forecasts (done at IRI)
8.2 Prediction • BIG ISSUES • Initialisation (ocean and land) • Evaluation of probabilistic forecasts • Predictability of statistics of weather for applications • Dynamical model improvements needed
Seasonal Prediction Centres http://www.meto.gov.uk/research/seasonal/index.html http://www.cpc.ncep.noaa.gov/products/predictions/90day/ http://nsipp.gsfc.nasa.gov/ http://www.ecmwf.int/products/forecasts/seasonal/introduction/ http://iri.columbia.edu/ http://grads.iges.org/cola.html