Lecture 4. Linear Models for Regression
Lecture 4. Linear Models for Regression. Outline. Linear Regression Least Square Solution S ubset Least Square subset selection/ f orward /backward P enalized Least Square: Ridge Regression LASSO E lastic Nets ( LASSO+Ridge ). Linear Methods for Regression.

Lecture 4. Linear Models for Regression
E N D
Presentation Transcript
Outline • Linear Regression • Least Square Solution • Subset Least Square • subset selection/forward/backward • Penalized Least Square: • Ridge Regression • LASSO • Elastic Nets (LASSO+Ridge)
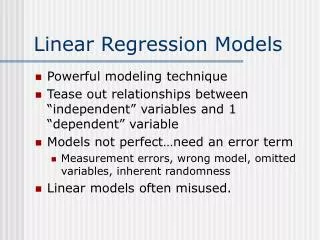
Linear Methods for Regression • Input (FEATURES) Vector: (p-dimensional) X = X1, X2, …, Xp • Real Valued OUTPUT: Y • Joint Distribution of (Y,X ) • Function: RegressionFunction E(Y |X ) = f(X) • Training Data : (x1, y1), (x2, y2), …, (xN, yN) for estimation of input-output relation f.
f(x): Regression function or a good approximation LINEAR in Unknown Parameters(weights, coefficients) Linear Model
Features • Quantitative inputs • Any arbitrary but known function of measured attributes • Transformations of quantitative attributes: g(x), e.g., log, square, square-root etc. • Basis expansions: e.g., a polynomial approximation of f as a function of X1 (Taylor Series expansion with unknown coefficients)
Features (Cont.) • Qualitative (categorical) input G • Dummy Codes: For an attribute with k categories, may use k codes j = 1,2, …, k, as indicators of the category (level) used. • Together, this collection of inputs represents the effect of G through • This is a set of level-dependent constants, since only one of the Xjequals one and others are zero
Features(cont) • Interactions: 2nd or higher-order Interactions of some features, e.g., • Feature vector for the ith case in training set (Example)
Wide variety of flexible models Model for f is a linear expansion of basis functions Dictionary: Prescribed basis functions Generalized Linear Models: Basis Expansion
Other Basis Functions • Polynomial basis of degree s (Smooth functions Cs). • Fourie Series (Band-limited functions, a compact subspace of C∞) • Splines • Piecewise polynomials of degree K between the knots, joined with continuity of degree K-1 at the knots (Sobolev Spaces). • Wavelets (Besov Spaces) • Radial Basis Functions: Symmetric p-dim kernels located at particular centroidsf(|x-y|) • Gaussian Kernel at each centroids • And more … -- Curse of Dimensionality: pcould be equal to or much larger than n.
Method of Least Squares • Find coefficients that minimize • Residual Sum of Squares, RSS(b) = • RSS denotes the empirical risk over the training set. It doesn’t assure the predictive performance over all inputs of interest.
Statistically Reasonable provided Examples in the Training Set Large # of independent random draws from the inputs population for which prediction is desirable. Given inputs (x1, x2, …, xN), the outputs (y1, y2, …, yN) conditionally independent In principle, predictive performance over the set of future input vectors should be examined. Gaussian Noise: the Least Squares method equivalent to Max Likelihood Min RSS(b) over b in R(p+1),a quadratic function ofb. Optimal Solution: Take the derivatives with respect to elements of b, and set them equal to zero. Min RSS Criterion
Optimal Solution • The Hession (2nd derivative) of the criterion function is given by XTX. • The optimal solution satisfies the normal equations XT(Y-X b) = 0 or (XTX) b = XTY • For an unique solution, the matrix XTX must full rank.
Projection • When the matrix XTX is full rank. the estimated response for the training set: H: Projection (Hat) matrix HY: Orthogonal Projection of Y on the space spanned by the columns of X • Note: the projection is linear in Y
One Variable with no intercept LS estimate inner product = cosine (angle between vectors x and y), a measure of similarity between y and x Residuals: projection on normal space Definition: “Regress b on a” Simple regression of response b and input a, with no intercept Estimate Residual “b adjusted for a” “borthogonalizedwith respect to a” Simple Univariate Regression
Multiple Regression:p>1 LS estimates different from simple univariate regression estimates, unless columns of input matrix X orthogonal, If then These estimates are uncorrelated, and Orthogonal inputs occur sometimes in balanced, designed experiments (experimental design). Observational studies, will almost never have orthogonal inputs Must “orthogonalize” them in order to have similar interpretation Use Gram-Schmidt procedure to obtain an orthogonal basis for multiple regression Multiple Regression
Regression by Successive Orthogonalization: Initialize For, j=1, 2, …, p, Regress to produce coefficients and residual vectors Regress y on the residual vector for the estimate Multiple Regression Estimates: Sequence of Simple Regressions Instead of using x1 and x2, take x1 and z as features
The vector zp is the residual of the multiple regression of xp on all other inputs Successive z’s in the above algorithm are orthogonal and form an orthogonal basis for the columns space of X. The least squares projection onto this subspace is the usual By re-arranging the order of these variables, any input can be labeled as the pth variable. If is highly correlated with other variables, the residuals are quite small, and the coefficient has high variance. Multiple Regression = Gram-Schmidt Orthogonalization Procedure
Model Uncorrelated noise: Mean zero, Variance Then Noise estimation Model d.f. = p+1 (dimension of the model space) To Draw inferences on parameter estimates, we need assumptions on noise: If assume: then, Statistics Properties of LS
Gauss-Markov Theorem • (The Gauss-Markov Theorem) If we have any linear estimator that is unbiased for aTβ, that is, E(cTy)= aTβ,then • It says that, for inputs in row space of X, LS estimate have Minimum variance among all unbiased estimates.
Bias-Variance Tradeoff • Mean square error of an estimator = variance + bias • Least square estimator achieves the minimal variance among all unbiased estimators • There are biased estimators to further reduce variance: Stein’s estimator, Shrinkage/Thresholding (LASSO, etc.) • More complicated a model is, more variance but less bias, need a trade-off
Hypothesis Test • Single Parameter test: βj=0, T-statistics • where vj is the j-th diagonal element of V = (XTX)-1 • Confidence interval , e.g. z1-0.0025=1.96 • Group parameter: , F-statistics for nested models
Example • R command: lm(Y ~ x1 + x2 + … +xp)
X : rank deficient Normal equations has infinitely many solutions Hat matrix H, and the projection are unique. For an input in the row space of X, unique LS estimate. For an input, not in the row space of X, the estimate may change with the solution used. How to generalize to inputs outside the training set? Penalized methods (!) Rank Deficiency
Prediction accuracy LS estimates have low bias but high variance when inputs are highly correlated Larger ESPE Prediction accuracy can sometimes be improved by shrinking or setting some coefficients to zero. Small bias in estimates may yield a large decrease in variance Bias/var tradeoff may provide better predictive ability Better interpretation With a large number of input variables, like to determine a smaller subset that exhibit the strongest effects. Many tools to achieve these objectives Subset selection Penalized regression -constrained optimization Reasons for Alternatives to LS Estimates
Best Subset Selection Method • Algorithm: leaps & bounds • Find the best subset corresponding to the smallest RSS for each size • For each fixed size k, can also find a specified number of subsets close to the best • For each fixed subset, obtain LS estimates • Feasible for p ~ 40. • Choice of optimal k based on model selection criteria to be discussed later
Other Subset Selection Procedures • Larger p, Classical • Forward selection (step-up), • Backward elimination (step down) • Hybrid forward-backward (step-wise) methods • Given a model, these methods only provide local controls for variable selection or deletion • Which current variable is least effective (candidate for deletion) • Which variable not in the model is most effective (candidate for inclusion) • Do not attempt to find the best subset of a given size • Not too popular in current practice
Forward Stagewise Selection • (Incremental) Forward stagewise • Standardize the input variables • Note:
Penalized Regression • Instead of directly minimize the Residual Sum Square, • The penalized regression usually take the form: • where J(f) is the penalization term, usually penalize on • the smoothness or complexity of the function f • λis chosen by cross-validation.
Model Assessment and Selection • If we are in data-rich situation, split data into three parts: training, validation, and testing. Train Validation Test See chapter 7.1 for details
Cross Validation • When sample size not sufficiently large, Cross Validation is a way to estimate the out of sample estimation error (or classification rate). Available Data Training Test Randomly split error1 Split many times and get error2, …, errorm ,then average over all error to get an estimate
Ridge Regression (Tikhonov Regularization) Prostate Cancer Example • Ridge regression shrinks coefficients by imposing a penalty on their size • Min a penalized RSS • Here is complexity parameter, that controls the amount of shrinkage • Larger its value, greater the amount of shrinkage • Coefficients are shrunk towards zero • Choice of penalty term based on cross validation
Equivalent problem Min RSS subject to Lagrangian multiplier 1-1 correspondence between s and With many correlated variables, LS estimates can become unstable and exhibit high variance and high correlations A widely large positive coeff on one variable can be cancelled by a large negative coeff on another Imposing a size constraint on the coefficients, this phenomena is prevented from occurring Ridge solutions are not invariant under scaling of inputs Normally standardize the inputs before solving the optimization problem Since the penalty term does not include the bias term, estimate intercept by the mean of response y. Ridge Regression (cont)
The Ridge criterion Shrinkage: For orthogonal inputs, ridge: scaled version of LS estimates Ridge is mean or mode of posterior distribution of under a normal prior Centered input matrix X SVD of X: U and V are orthogonal matrices Columns of U span column space of X Columns of V span row space of X D: a diagonal matrix of singular values Eigen decomposition of The Eigen vectors : principal components directions of X (Karhunen-Loeve direction) Ridge Regression (cont)
First PC direction : Among all normalized linear combinations of columns of X, the has largest sample variance Derived variable, is first PC of X. Subsequent PC have max variance subject to being orthogonal to earlier ones. Last PC has min variance Effective Degree of Freedmon Ridge Regression and Principal Components
Ridge Regression penalized the complexity of a linear model by the sum squares of the coefficients It is equivalent to minimize RRS given the constraints The matrix (XTX+ I) is always invertable. The penalization parameter controls how simple “you” want the model to be. Ridge Regression (Summary)
Solutions are not sparse in the coefficient space. - ’s are not zero almost all the time. The computation complexity is O(p3) when inversing the matrix XTX+ I. Ridge Regression (Summary) Prostate Cancer Example
Penalized RSS with L1-norm penalty, or subject to constraint Shrinks like Ridge with L2-norm penalty, but LASSO coefficients hit zero, as the penalty increases. Least Absolute Shrinkage and Selection Operator (LASSO)
LASSO as Penalized Regression • Instead of directly minimize the Residual Sum Square, • The penalized regression usually take the form: • where
The computation is a quadratic programming problem. We can obtain the solution path, piece-wise linear. Coefficients are non-linear in response y (they are linear in y in Ridge Regression) Regularization parameteris chosen by cross validation. LASSO(cont)
LASSO and Ridge Contour of RRS in the space of ’s
Generalize to L-q norm as penalty • Minimize RSS subject to constraints on thel-q norm • Equivalent to Min • Bridge regression with ridge and LASSO as special cases (q=1, smallest value for convex region) • For q=0, best subset regression • For 0<q<1, it is not convex!
Why non-convex norms? • LASSO is biased: • Nonconvex Penalty is necessary for unbiased estimator
Elastic Net as a compromise between Ridge and LASSO (Zou and Hastie 2005)
The Group LASSO • Group LASSO • Group norm l1-l2 (also l1-l∞) • Every group of variable are simultaneously selected or dropped
Methods using Derived Directions • Principal Components Regression • Partial Least Squares
Principal Components Regression • Principal Components Regression (M<p) • Motivation: leading eigen-vectors describe most of the variability in X Z1 Z2 X2 X1
Principal Components Regression • Zi and Zj are orthogonal now. • The dimension is reduced. • High correlation between independent variables are eliminated. • Noises in X’s are taken off (hopefully). • Computation: PCA + Regression