Download
1 / 39
390 likes | 565 Vues
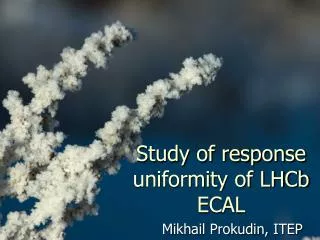
Analysis of Filter Transmission Uniformity Specifications . Huan Lin Experimental Astrophysics Group Fermilab. PanSTARRS Filters from Barr. Similar to DES filters: 570 mm size 10 mm thick Fused silica substrates Data on griz filters available. PanSTARRS i-band filter. from B. Bigelow.

E N D
Analysis of Filter Transmission Uniformity Specifications Huan Lin Experimental Astrophysics Group Fermilab
PanSTARRS Filters from Barr • Similar to DES filters: • 570 mm size • 10 mm thick • Fused silica substrates • Data on griz filters available PanSTARRS i-band filter from B. Bigelow
PanSTARRS Filter • The red dots are the positions where the filters were evaluated. • 9 radial points every 1”, last point at 9.5” • I’m calling these positions 1-11, from center to edge • Position 7 is used as reference • Eight azimuthal points side 1 side 2 adapted from M. Schubnell
i band from B. Bigelow
i band from B. Bigelow
g band from B. Bigelow
Filter Transmission Uniformity Analysis • Give filter specifications to vendors using upper and lower absolute transmission envelopes, similar to PanSTARRS filters • DES photometric calibration requirement is 2%; assign 1% error budget component to filters to account for spatial non-uniformity in filter transmissions • Test sets of filter curves fitting within absolute envelopes in order to specify transmission spatial uniformity requirements • Use galaxy SEDs (E, Sbc, Scd, Im) from Bruzual & Charlot GISSEL package: CWW SEDs extended using theoretical models to the UV and IR • Calculate fractional flux differences, vs. average of all test filter curves, for 4 galaxy SEDs over redshift ranges relevant to main optical spectral features: 4000Å break, [OII] 3727 and [OIII] 5007 lines • Also account for transmission variations due to changes in incidence angle over focal plane • Use galaxy analysis results to define “fraction envelopes” on transmission uniformity
Im: [OII] 3727 Å E: < 3200 Å feature E: 4000 Å Im: [OIII] 5007 Å
Example Absolute Transmission Envelopes for i-band Filter Average filter transmission required to fit within absolute transmission envelopes
Example Transmission Uniformity (“Fraction”) Envelopes for i-band Filter Shape of filter transmission relative to average required to fit within “fraction” envelopes
Status • Derived filter transmission and spatial uniformity envelopes, based on relative photometric calibration requirements applied to galaxy spectra • Contributions of “envelope” and “incidence angle” effects are about the same, for adopted 0.84% fractional flux cut used to define acceptable envelopes, and for Barr/PanSTARRS neff values • Current acceptable envelopes should lead to < 1.2% fractional flux difference for galaxies • Vendor responses to filter RFI (see M. Schubnell talk, docdb #1635) indicate it is too expensive and/or difficult to meet our current uniformity specifications, basically about 3% transmission variation over flat parts of filters • Will try using color terms (which are no longer avoidable) and see if non-uniformity of Barr’s PanSTARRS filters can still be acceptable for DES • Derive approximate relaxed uniformity specifications
Revised Filter Transmission Uniformity Analysis, with Color Terms • Use measured filter transmissions at different radial positions for PanSTARRS filters • Use position 7 as reference transmission; it’s approximately the median (see next slide) • Also use DES filters with gradients applied to derive results more directly applicable to DES, as PanSTARRS filter bandpasses differ in detail • Use Pickles stellar library, with 131 spectra of wide range of stellar types, to derive transformations between the magnitudes at different filter positions • Use quadratic fits: e.g., g - g0 = a + b(g0-r0) + c(g0-r0)2 • Use reference colors g-r for g, r-i for r, and i-z for i and z • Use same galaxy SEDs (E, Sbc, Scd, Im) as before • Also consider SN Ia “Hsiao” templates (via John Marriner) at -7, 0, +7, +14 days vs. maximum • Apply color transformations from stars to galaxies and SNe and look at residuals vs. redshift and color • Aim for 1% photometric errors as acceptable for the filter contribution to the total 2% error budget
Original g-band filter in black Tilt by gradients of up to 10% edge to center Shift cut-on and cut-off by up to 50 Å
Galaxies 10% gradient filters
Galaxies 5% gradient filters
FWHM vs. central wavelengths Red points indicate <1% flux errors for galaxies
Cut-on vs. cut-off wavelengths (half-maximum points) Red points indicate <1% flux errors for galaxies
Conclusions • Keep same absolute transmission envelopes • Relaxed transmission uniformity specifications possible, by using color terms based on stars, and applying to galaxies and SNe Ia • Gradients (edge to center) < 5 10% required to keep filter photometric error contribution to < 1% • About 2-3 times less stringent than original ~3% uniformity specification when color terms not allowed • PanSTARRS filters from Barr can nearly meet this • Also need typically 20 Å requirement on cut-on and cut-off wavelengths (half-maximum points)
DECam Filter Wavelengths and Transmission Requirementsfrom DECam Technical Specifications (document #806) • TO.15 Filter transmission requirements: > 85% in [g, r, i, z] • Table 3 Filter Transmission Requirements
DECam Filter Specificationsfrom DECam Technical Specifications (document #806) and DECam Filter RFI (document #1045) Substrate dimensions: 620 mm diameter Substrate material: fused silica Minimum clear aperture: 610 mm diameter, concentric with substrate diameter Total thickness: 13 mm Surface parallelism: 30 arc-seconds or better Bubble class: 0 (req. 0.1 mm2 per 100 cm3; goal 0.03 mm2 per 100 cm3) Maximum bubble size: 0.5 mm diameter Striae: requirement of 30 nm, goal of 20 nm Pinhole limits: None with D > 60 microns; no more than one of the size 30-60 microns over an aperture of 50 mm, nor more than a combined equivalent area of 30 microns per 10 mm region of an aperture. Surface quality: 80-50 scratch-dig Durability: Mil-C-48479 (moderate abrasion) Surface quality: Filter edges are to be sealed to prevent moisture incursions into the substrate Radioisotope limits in filter substrate: U<0.8 ppm, Th<2.5ppm, K<0.03% (by weight) Radioisotope limits in filter coatings: U<80 ppm, Th<250ppm, K<3% (by weight)
DECam Filter Specifications (cont’d)from DECam Technical Specifications (document #806) and DECam Filter RFI (document #1045) Operating focal ratio: f/2.9 Optical thickness: All filters shall have the same optical thickness, ±0.10 mm air equivalent. Transmitted wave error in 125 mm diameter sub-aperture: < λ/4 Beam Angles of Incidence: 0 – 4 degrees for f/2.9 beams (maximum range 0-12 deg) Coatings: All air-glass interfaces are to be anti-reflection (AR) coated. Predicted performance of the AR coatings should be provided with the quotation. Filter substrate edges to be sealed against moisture penetration. Transmission: Specified by absolute transmission envelopes vs. wavelength, and spatial uniformity specified by “fraction envelopes” (see later this talk) Normal operating temperature: -5C to 27C Survival temperature range: -56C to 40C Normal operating humidity range: 0-60% (dry nitrogen environment) Survival humidity range: 0-100% Normal operating elevation: 2200 m (7220 ft) Normal operating pressure: 570-590 Torr Operational lifetime: 10 years
Top Level Photometric Calibration Science Requirements (version 6.5 draft of document) • S-16 The magnitudes of an object may be calculated to within 2% by convolving the spectrum of the object with the system response curves. This requirement assumes that the spectra are spectrophotometrically calibrated and that the system response curves are absolute. • This is the total photometric calibration requirement • S-17 The magnitudes vary only by –2.5 log f2/f1, independent of position in the final map to within 2% (1% enhanced goal), where f2/f1 is the ratio of photon fluxes. This is to be true in g, r, i, z individually. • This is basically the relative photometric calibration requirement • We’ll focus on this • S-18 The magnitudes have an absolute zero point that is well-defined and known to 0.5%. The magnitudes will be on the natural instrument system. • This is basically the absolute photometric calibration requirement
Proposed Relative Photometric Calibration Science Requirements • S-19 Uncorrected nonlinearities due to imperfect shutter timing and nonlinear CCD/amplifier gain shall be less than 0.3%, measured as the peak error between shortest and longest exposure times, and between the faintest and brightest unsaturated stars. • S-20 The aperture correction shall have an internal rms error no bigger than 0.6% for any CCD and seeing between 0.8” and 1.5”. • S-21 The rms photometric errors due to imperfect flatfielding (including errors in removing the ghost image of the night sky and removing other stray light sources) will be no worse than 0.84%. • S-22 The rms photometric variations due to spatial changes in the shape of the system optical transmission (telescope, corrector lenses and coatings, and filters) will be no worse than 0.84%. • S-23 The rms photometric variations due to spatial changes in the shape of the CCD QE vs. wavelength curve will be no worse than 0.84%. • S-24 The rms photometric errors due to imperfect removal, using the global relative photometric calibration solution, of temporal and spatial changes in the atmospheric transparency and extinction, will be no worse than 0.84%. • S-25 The rms photometric errors due to imperfect corrections for astrometric and other distortions on the focal plane (including those due to the optical design and to the CCD “glowing edges”) will be no worse than 0.84%. • Kept 1st two requirements at 0.3% and 0.6% • Leaves remaining 1.88% for last 5 terms, divide by sqrt(5) to get 0.84% per requirement
SNe Ia 10% gradient filters
SNe Ia 5% gradient filters
z/Z, Y Filter Issues • Need to assess impact of including/excluding variable atmospheric absorption feature at 9300-9600 Å to finalize z/Z bandpass • Excluding it improves photometric calibration • Including it improves S/N, e.g., for redshift = 1 elliptical galaxy • Z (8500-9700 Å) gives 30% better S/N cf. Z (8500-9200 Å) • z (8500-10000 Å) gives 50% better S/N cf. Z(8500-9200 Å) • Excluding it improves photometric calibration • Both LSST and PanSTARRS are using such a Z filter • Need data on absorption variability to quantify impact on calibration errors • Y filter bandpass • Consistent with VISTA, LSST, and PanSTARRS choices of blue cutoff • Need to check DES CCD QE turn-off variability to finalize red cutoff • Need to define Y-band science requirements to confirm if larger calibration uncertainties (> 2 %) are acceptable