Estimating Binomial Distributions Using Normal Approximation in Hotel Overbooking Scenarios
530 likes | 653 Vues
This explanation focuses on how to estimate binomial distributions using the normal distribution, particularly in scenarios involving hotel overbooking. Given a hotel with 400 rooms and a policy to book 450 reservations due to a 13% no-show rate, we will calculate the probability of having more guests than available rooms. We will apply the normal approximation to the binomial distribution for efficiency, ensuring conditions are met. We'll demonstrate how to find the probability of guests showing up, specifically looking at cases where 9 or more girls are born out of 14 births using probabilities.

Estimating Binomial Distributions Using Normal Approximation in Hotel Overbooking Scenarios
E N D
Presentation Transcript
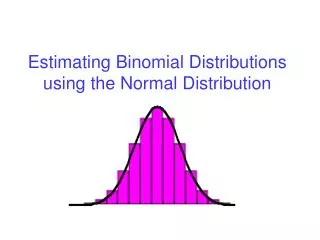
Estimating Binomial Distributionsusingthe Normal Distribution
A hotel has 400 rooms. The policy of the hotel is to over book the rooms because 13% of the people making reservations never show up. So the hotel makes 450 reservations each night. What percent of the time does the hotel have a the problem by over booking the rooms? ( ie. Not having enough rooms for the people that do show up) So we calculate the probability of all the reservations over 400 showing up to the hotel. P(401) + P(402)+ … + P(450) Is there a better way?
YES!! We will estimate a Binomial Distributionusingthe Normal Distribution
Review Binomial Probability Distribution 1. The procedure must have fixed number of trials. 2. The trials must be independent. 3. Each trial must have all outcomes classified into two categories. 4. The probabilities must remain constant for each trial. Solve by binomial probability formula or technology
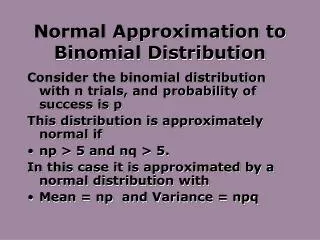
Approximate a Binomial Distributionwith a Normal Distribution if: np(1-p) 10
Approximate a Binomial Distributionwith a Normal Distribution if: np(1-p) 10 then µ = npand = npq and the random variable has a distribution. (normal)
The following is a probability distribution of the number of girls out of 14 births
What is the probability of getting 9 or more girls? Assuming P(girl) = 0.5 We should sum up all of the rectangles from 9 up to 14. This is too much work so we will want to do this using the standard normal curve.
What is the probability of getting 9 or more girls? Assuming P(girl) = 0.5 So lets find the P(x ≥ 9)
What is the probability of getting 9 or more girls? Assuming P(girl) = 0.5 But we can’t find P(x≥9) because we will lose part of the number 9 rectangle the Yellow section. The yellow section represents half of the probability for 9 girls. We can not leave this out. So need to find the probability for P(X ≥ 8.5)
8.5 What is the probability of getting 9 or more girls? Assuming P(girl) = 0.5 So finding P(x ≥ 8.5). We want area to right of the red line. But note we are including and excluding some area.
What is the probability of getting 9 or more girls? Assuming P(girl) = 0.5 The excluded area and the included area are close to the same size. So we will use this method to approximate the total area to the right of the red line 8.5
What is the probability of getting 9 or more girls? Assuming P(girl) = 0.5 So lets find the P(x ≥ 8.5). By finding the area of the blue region. This will include all of the rectangle for 9 births and above. P(x ≥ 8.5) = P(Z ≥ 0.80) = 1 - .7881 = 0.2119
What is the probability of getting 9 or more girls? Assuming P(girl) = 0.5 We should sum up all of the rectangles from 9 up to 14. The approximated method is = 0.2119 Wow! Pretty close.
x = exactly 9 9 8.5 9.5 Interval represents discrete number 9
x = at least9 = 9,10,11,12, . . . 8.5 9 .
9 x = at least9 = 9,10,11,12, . . . . 9 8.5 x = more than 9 = 10, 11, 12, . . . 9.5
9 9 x = at least9 = 9,10,11, . . . . 520 519.5 x = more than 9 = 10, 11, 12, . . . 9.5 x = at most9 = 0, 1, . . . 7, 8, 9 9.5
9 9 x = at least9 = 9,10,11, . . . . 520 519.5 x = more than 9 = 10, 11, 12, . . . 9.5 x = at most9 = 0, 1, . . . 7, 8, 9 9.5 x = fewer than 9 = 0, 1, . . . 7, 8 8.5 9
x = at least9 = 9,10,11,12, . . . . 9 8.5 x = more than 9 = 10, 11, 12, . . . 9 9.5
Procedure for Using a Normal Distribution to Approximate a Binomial Distribution 1. Establish that the normal distribution is a suitable approximation to the binomial distribution by verifying np(1-p) 10. 2. Find the values of the parameters µ and by calculating µ = np and = npq. 3. Identify the discrete value of x (the number of successes). Change the discrete value x by replacing it with the interval from x - 0.5 to x + 0.5. Draw a normal curve and enter the values of µ , , and either x - 0.5 or x + 0.5, as appropriate. continued
Procedure for Using a Normal Distribution to Approximate a Binomial Distribution continued 4. Change x by replacing it with x - 0.5 or x + 0.5, as appropriate. 5. Find the area corresponding to the desired probability.
Definition When we use the normal distribution (which is continuous) as an approximation to the binomial distribution (which is discrete), a continuity correction is made to a discrete whole number x in the binomial distribution by representing the single value x by the interval from x - 0.5 to x + 0.5.
A hotel has 400 rooms. The policy of the hotel is to over book the rooms because 13% of the people making reservations never show up. So the hotel makes 450 reservations each night. What percent of the time does the hotel have a the problem by over booking the rooms? ( ie. Not having enough rooms for the people that do show up)
This is a Probability Distribution Histogram of 450 reservations with P(no show) = 0.13
The blue bars represent probability of the hotel being overbook. That is more than 400 reservations show. P(no show) = 0.13
The sum of all the blue bars is an approximation of the binomial situation of the hotel being over booked. Sum P(401) to P(450). P(no show) = 0.13
A hotel has 400 rooms. The policy of the hotel is to over book the rooms because 13% of the people making reservations never show up. So the hotel makes 450 reservations each night. What percent of the time does the hotel have a the problem by over booking the rooms? ( ie. Not having enough rooms for the people that do show up) So we calculate the probability of all the reservations over 400 showing up to the hotel. P(401) + P(402)+ … + P(450)
A hotel has 400 rooms. The policy of the hotel is to over book the rooms because 13% of the people making reservations never show up. So the hotel makes 450 reservations each night. What percent of the time does the hotel have a the problem by over booking the rooms? ( ie. Not having enough rooms for the people that do show up) Conditions: np(1-p) ≥ 10 450(.13)(.87)= 50.895 ≥ 10 Find Mean np = μ So 450(.13) = 391.5 391.5
A hotel has 400 rooms. The policy of the hotel is to over book the rooms because 13% of the people making reservations never show up. So the hotel makes 450 reservations each night. What percent of the time does the hotel have a the problem by over booking the rooms? ( ie. Not having enough rooms for the people that do show up) P(x ≥ 401) = P(Z ≥1.26) = 1 - .8962 = 0.1038 So about 10% of the time the hotel will be over booked. Using the binomial formula & calculator yields .1015
Finding the Probability of “At Least” 520 Men Among 1000 Accepted Applicants
x = at least520 = 520, 521, 522, . . . . 520 519.5 x = more than 520 = 521, 522, 523, . . . 521 520.5
x = at least520 = 520, 521, 522, . . . . 520 519.5 x = more than 520 = 521, 522, 523, . . . 521 520.5 x = at most520 = 0, 1, . . . 518, 519, 520 520 520.5
. 9 8.5 x = more than 520 = 521, 522, 523, . . . 521 520.5 x = at most520 = 0, 1, . . . 518, 519, 520 520 520.5 x = fewer than 520 = 0, 1, . . . 518, 519 519 519.5
x = exactly 9 9 8.5 9.5 Interval represents discrete number 9
x = at least9 = 9,10,11,12, . . . . 9 8.5 x = more than 9 = 10,11,12,13, . . . 9 9.5
x = at least9 = 9,10,11,12, . . . . 9 8.5 x = more than 9 = 10,11,12,13, . . . 9 9.5
A hotel has 400 rooms. The policy of the hotel is to over book the rooms because 13% of the people making reservations never show up. So the hotel makes 450 reservations each night. What percent of the time does the hotel have a the problem by over booking the rooms? ( ie. Not having enough rooms for the people that do show up)
A hotel has 400 rooms. The policy of the hotel is to over book the rooms because 13% of the people making reservations never show up. So the hotel makes 450 reservations each night. What percent of the time does the hotel have a the problem by over booking the rooms? ( ie. Not having enough rooms for the people that do show up) Conditions: np(1-p) ≥ 10 450(.13)(.87)= 50.895 ≥ 10 Find Mean np = μ So 450(.13) = 391.5 391.5
This is a Probability Distribution Histogram of 450 reservations with P(no show) = 0.13
The blue bars represent probability of the hotel being overbook. P(no show) = 0.13
The sum of all the blue bars is an approximation of the binomial situation of the hotel being over booked. P(no show) = 0.13