3. Distributions 3.1 Binomial distribution
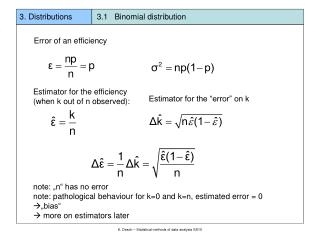
3. Distributions 3.1 Binomial distribution. Error of an efficiency. Estimator for the efficiency (when k out of n observed):. Estimator for the “error” on k. note: „n“ has no error note: pathological behaviour for k=0 and k=n, estimated error = 0 „bias“

3. Distributions 3.1 Binomial distribution
E N D
Presentation Transcript
3. Distributions 3.1 Binomial distribution Error of an efficiency Estimator for the efficiency (when k out of n observed): Estimator for the “error” on k • note: „n“ has no error • note: pathological behaviour for k=0 and k=n, estimated error = 0 • „bias“ • more on estimators later K. Desch – Statistical methods of data analysis SS10
3. Distributions 3.2 Poisson distribution • Discrete probability distribution • Describes events whose individual probability p is very small while • the number of trials N is very large, such that Np is finite • Examples: • radioactive decay of source (e.g. 1023 nuclei, only few decays per second) • number of raisins in a slice of cake (r(raisin) << r(cake) • probability to observe N collisions of a given type in a collider experiment • ( N(colliding particles/bunch) >> N(collisions) ) • number of lightnings in a thunder strom within 1 minute • number of plane crashes per year, … • All these examples can in principle be treated by the Binomial Distribution • but numerically tedious (factorials of large numbers) • Sometime neither N nor p but only Np =: is known (or can be estimated) K. Desch – Statistical methods of data analysis SS10
3. Distributions 3.2 Poisson distribution Math. derivation (from Binomial distribution): Poisson distribution: K. Desch – Statistical methods of data analysis SS10
3. Distributions 3.2 Poisson distribution K. Desch – Statistical methods of data analysis SS10
3. Distributions 3.2 Poisson distribution • Alternative (more physical) derivation: • - assume an experiment which counts r events in a time T • divide T in small intervals t, such that in one interval only 0 or 1 events occur • Probability for one event in [t,t+t]: t • Probability for no event in [t,t+t]: 1- t • Call probability for no event in [0,t] =: Po(t) Poisson for 0 events K. Desch – Statistical methods of data analysis SS10
3. Distributions 3.2 Poisson distribution Probability for one event: either in [0,t] or [t,t+t] K. Desch – Statistical methods of data analysis SS10
3. Distributions 3.2 Poisson distribution (properties) Normalization: Expectation value: Variance: follows from variance of Binomial distribution K. Desch – Statistical methods of data analysis SS10
3. Distributions 3.2 Poisson distribution (properties) • Note: Binomial distribution bounded from above (k <= N) • Poisson not bounded from above • Not poisson distributed: • number of decays of a radioactive source per intervall T • when T ~ o () (lifetime) • observed rate of event in a thick target K. Desch – Statistical methods of data analysis SS10
3. Distributions 3.3 Gaussian distribution Gauss (Normal) distribution: Random Variable: x (continuous) Two Parameters: Most important probability distribution! Consistent with Poisson distribution for large Consistent with Binomial distribution for large n Normalization: Expectation value: Variance: K. Desch – Statistical methods of data analysis SS10
3. Distributions 3.3 Gaussian distribution Useful integrals: symmetric: [-1,1] = 68.27 % [-2,2] = 95.45 % [-3,3] = 99.73 % one-sided: [-,1] = 84.13 % [-,2] = 97.72 % [-,3] = 99.87 % K. Desch – Statistical methods of data analysis SS10
3. Distributions 3.3 Gaussian distribution: limits Binomial distribution Poisson distribution Normal distribution Proof: K. Desch – Statistical methods of data analysis SS10
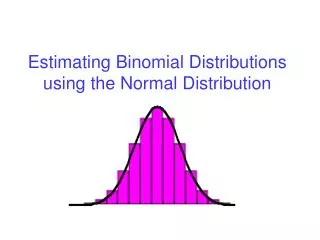
3. Distributions 3.3 Gaussian distribution Comparison: Gauss and Poisson distributions K. Desch – Statistical methods of data analysis SS10
3. Distributions 3.3 Gaussian distribution Two-sided Gaussian integral K. Desch – Statistical methods of data analysis SS10
3. Distributions 3.3 Gaussian distribution One-side Gaussian integral K. Desch – Statistical methods of data analysis SS10
3. Distributions 3.3 Gaussian distribution Full Width at the Half-Height (FWHH) Gauss error function Integrated Gauss function K. Desch – Statistical methods of data analysis SS10
3. Distributions 3.4 Multi-dimensional Gaussian Multidimensional Gauss distribution N Gauss distributed random variables with mean and covariance matrix V ( ). The common p.d.f.: For two dimensions: Area inside 1-interval: 39.35% (smaller than in 1D case !) K. Desch – Statistical methods of data analysis SS10
3. Distributions 3.5 Characteristic function Characteristic function: up to a factor; Fourier transform of f(x) Obtain the original p.d.f. by back transformation: For discrete random variables: Back transformation: K. Desch – Statistical methods of data analysis SS10
3. Distributions 3.5 Characteristic function for Gauss distribution with =0 (normal distribution) also normal distribution with variance 1/σ2 For Gauss distribution with arbitrary : phase K. Desch – Statistical methods of data analysis SS10
3. Distributions 3.5 Characteristic functions Characteristic function of a sum of random variables is the product of the characteristic functions of these variables: Proof: Moments can easily be found from characteristic functions K. Desch – Statistical methods of data analysis SS10
3. Distributions 3.5 Characteristic functions Sum of two Gauss distributions is also distributed according to a gaussian with: and Proof: K. Desch – Statistical methods of data analysis SS10