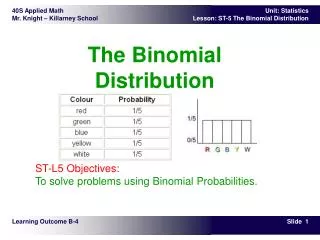
Binomial Distribution
This document explores the concepts of Binomial and Geometric Distributions, showcasing how to utilize R software for statistical computing. With examples such as the density function of a Binomial Distribution for n=30 and p=0.5, we can visualize data through plots. It also includes cumulative density functions across different probabilities. R is highlighted as a powerful and free resource that generates statistical figures effortlessly. Learn how these distributions can apply in various statistical analyses and real-world applications.

Binomial Distribution
E N D
Presentation Transcript
Binomial Distribution http://www.r-project.org/ Xijin Ge SDSU Math/Stat All figures were generated using R. R is free yet powerful software for statistical computing. http://www.r-project.org/
Density function of binomial dist. n=30 p=0.5 plot(0:10,dbinom(0:30, size=30, prob =0.5), type=“b”)
P=0.3 P=0.5
P=0.06 P=0.3 P=0.5
P=0.06 P=0.94 P=0.3 P=0.5
p=0.5 p=0.2
p=0.5 p=0.2 p=0.05
Log-scale p=0.05 p=0.5 p=0.2