Binomial Distribution in Statistics
Learn how to analyze data, create probability tables, calculate mean and standard deviation, and use TI and Statdisk for binomial distribution. Complete your homework using provided tools.


Binomial Distribution in Statistics
E N D
Presentation Transcript
The Binomial Distribution Math 153 – Introduction to Statistical Methods
Objectives • Determine if a scenario fits the definition of a binomial distribution. • Analyze raw data collected from the Internet • Create both the computer package Statdisk and the binompdf command on your TI to create the table. • Determine the mean and standard deviation of a binomial distribution.
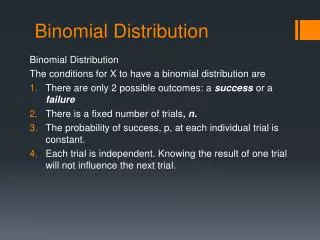
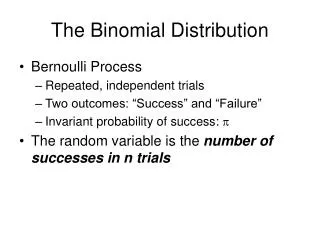
4 Conditions for a Binomial Experiment • Fixed number of trials • Each trial is independent of any other trial • The probability remains constant throughout the experiment • There are exactly two possible outcomes
Creating a Probability Table • Set up your two columns, x and P(x). • Identify the values of n, p, q and x. • use the formula below for each value of x
Determining Binomial Probabilities Using your TI • Select 2nd DISTR (above the VARS key) • Select option 0, binompdf( • Enter the values of n, p, x). • Note the values entered must be in this order, separated by commas. • Select the ENTER key. • If you need further assistance, please go to the TI Tutorial.
Using Statdisk to create Binomial Distribution Table • From the menu bar, select ANALYSIS >> BINOMIAL PROBABILITIES. • Fill in the number of trials and the probability of success in the corresponding boxes. • Hit the EVALUATE button. • If you need further assistance, go to your Statdisk tutorial.
Determining the Mean and Standard Deviation Using a Calculator • On the TI, use the formula
Determining the Mean and Standard Deviation Using Statdisk • The mean, variance and standard deviation are all given on the same screen as the probability distribution table.
Homework • Your next web assignment can be found at the Webquest link. Complete all questions using Microsoft Word, your TI and Statdisk. Email me your completed project.