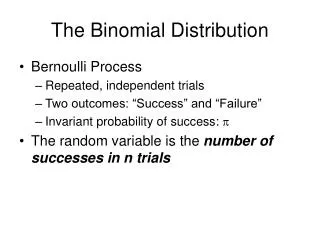
The Binomial Distribution
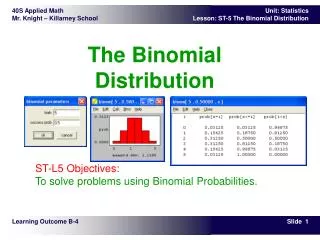
The Binomial Distribution. ST-L5 Objectives: To solve problems using Binomial Probabilities. Learning Outcome B-4.

The Binomial Distribution
E N D
Presentation Transcript
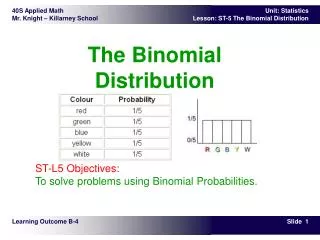
The Binomial Distribution ST-L5 Objectives:To solve problems using Binomial Probabilities. Learning Outcome B-4
In a previous module, you were assigned the following question:A ball is dropped into the top of the game. Each time it strikes a pin (triangle), it is equally likely to go to the left or right. The ball will continue downwards until it stops in one of the slots A to E. • What is the probability that the ball will come to rest in slot D? • What is the probability that the ball will come to rest in slot C? • What is the probability that the ball will come to rest in slot E? • The ball always goes in one of two ways at each pin. In this lesson, you will learn that this problem and others like it are binomial problems, and you will learn new ways to solve these problems using IT. Theory – Intro
In some probability experiments there are two or more outcomes, and all the outcomes are equally likely. For example, A bag contains five marbles that have the same shape and size but different colours (Red, Green, Blue, Yellow, White). An experiment consists of randomly selecting one marble, noting its colour, returning it to the bag, and then repeating the experiment many times. The theoretical probability of selecting any colour is 1/5, and a probability distribution chart and graph are shown below. The experimental probabilities after many trials would likely be quite similar to the theoretical probabilities. The above example is an example of a uniform distribution, where all the outcomes are equally likely. This is an example of a non-normal distribution. In this lesson you will study normal and binomial distributions, and you need to recognize the different kinds of distributions. Theory – A Uniform (Non-Normal) Distribution
In some probability experiments, there are exactly two possible outcomes. For example: • When flipping a coin, you get heads or tails. When flipping a coin 200 times, what is the probability of getting heads exactly 101 times? (The answer is 5.58 percent) • When answering a question on a multiple choice test, your answer will be right or wrong. What is the probability of getting 50 percent of the answers correct if there are four choices for each question, and you guess each answer? • When a manufacturer guarantees a toaster for one year, the toaster will work fine or fail in one year. The manufacturer knows that, on average, 5 percent of the toasters fail. What is the probability that the manufacturer will have to replace 120 or more toasters in a year when 2000 toasters are sold? • These are examples of binomial problems. In this lesson, you will learn to recognize binomial events and solve binomial problems similar to the ones shown above. Introduction to Binomial Distributions
Consider the following binomial situation.When you flip four coins, the following 16 outcomes are equally likely. The theoretical probabilities are:And: P(4H) + P(3H) + P(2H) + P(1H) + P(0H) = Theory – Sample Space of a Binomial Event
A probability distribution is a table or graph that shows the theoretical probability of each outcome of a binomial experiment.The list of probabilities shown above and the histogram on the right are probability distributions because they show the theoretical probabilities of each outcome. Note that the shape of the graph is similar to a histogram of a normal distribution. • In a probability distribution: • the probability of each outcome is between 0 and 1 • the sum of all the probabilitiesis always 1 Theory – Sample Space of a Binomial Event cont’d
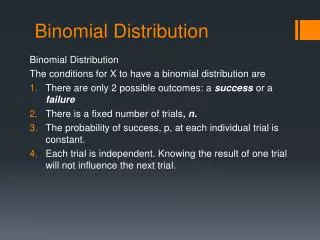
A binomial experiment has a specific number of trials, and there are exactly two possible outcomes. One outcome is classified as a success, and the other a failure. The outcomes are independent of each other. This means that the probability of success or failure is the same for each trial.On the previous page, you saw a sample space showing all the outcomes when flipping four coins. We now want to do a binomial experiment to determine the experimental outcomes when flipping four coins many times--say 1000 times. Since this experiment would take much time, we will use Winstats to simulate the experiment. A Binomial Experiment: Flipping Coins
Do the following: • Open Winstats. • Select Window, then Simulate, and then Flip Coins… A new window should open. • In the new window, select Params, and set: • probability of head = 0.50 • how many coins = 4 • 4. Select Do, and then Number, and set: • how many = 1000 • Select Do and Many • Select Do, then Data, and then Histogram… A new window with a histogram should appear. • In the histogram window, click on Normal. • Select Do, then Data, and then Frequencies… A new window showing the frequencies of the different outcomes should appear. You may drag the windows around and resize them any way you want.Note: You can now see the results of a simulated experiment where you flip four coins 1000 times. A Binomial Experiment: Flipping Coins (cont’d)
Repeat the experiment by selecting Do and then Many. The frequency chart and the histogram should show the results of the new experiment. You need to click Normal each time to see the comparison to a normal distribution curve. • Do #9 as frequently as you wish to see the results of many experiments. • A binomial distribution is a probability distribution that shows the experimental probabilities of each outcome. As you could see from the experiment, the experimental probability distribution becomes quite similar to the theoretical probability distribution for a large number of repetitions. A Binomial Experiment: Flipping Coins (cont’d)
Sample Binomial Problem:A manufacturer produces 24 yard alarms per week. Six percent of all the alarms produced are defective. What is the probability of getting two defective alarms in one week?The above problem is an example of a binomial probability experiment. Some properties of a binomial experiment are: • There are a set number of trials in this experiment. In this case, there are 24 trials. • Each trial has exactly two possible outcomes: alarm works / alarm fails • Events are independent. This means that the probability of success is the same for each trial (i.e., each alarm system has a 6 percent probability of being defective). Theory - The Properties of a Binomial Problem
We will be looking for the probability of successes. i.e., P(two defective alarms) = ? • The total of all probabilities is 1. This means that the alarm works or fails, and that no other possibility exists. • The data in a binomial problem are always discrete. In this case, it means that the number of alarms is an integral value (1, 2, 3, 4, et cetera) which can be counted, and is not a continuous (i.e., measured) value, as is the case in a normal distribution Theory - The Properties of a Binomial Problem (cont’d)
The previous problem is repeated here.A manufacturer produces 24 yard alarms per week. Six percent of all the alarms produced are defective. What is the probability of getting two defective alarms in one week? 'S' and 'F' (Success and Failure) are the possible outcomes of a trial in a binomial experiment, and 'p' and 'q' represent the probabilities for 'S' and 'F.' P(S) = p P(F) = q = 1 - p n = the number of trials x = the number of successes in n trials, and 0 x n p = probability of success q = probability of failure P(x) = probability of getting exactly x successes in n trials Note that 'S' represents the outcome with probability 'p', and the value 'x' always represents the same kind of outcome as 'p'. In this case, we are looking for the probability of selecting a defective alarm. Theory - Notation Used in Binomial Problems
S = the event that the alarm is defective • P(S) = p = 0.06 • x = 2 • P(x = 2) = ? • On the next pages, you will be shown how to solve this and other similar problems using IT. Theory - Notation Used in Binomial Problems (cont’d)
The previous problem is repeated here.A manufacturer produces 24 yard alarms per week. Six percent of all the alarms produced are defective. What is the probability of getting two defective alarms in one week?Solution using Winstats. • Select Windows, then Probability, and then Binomial… A new window should open. • In the new window, select Settings, and then Parameters… A new small window should open. • In the parameters window, enter: prob = 0.06 tries = 24 • Select Table in the Binom[etc window. A new window showing a probability table should open. You can use this table to answer any binomial probability question. Theory - Using IT to Find a Binomial Probability
As shown on the table, the probability of having two faulty alarm systems is 0.255,i.e., P(x = 2) = 0.255. This means that there is a 25.5 percent chance of having two faulty alarm systems in one week. Theory - Using IT to Find a Binomial Probability
There are five children in a family. Assume that boys and girls are equally likely. • What is the probability that three are girls? • What is the probability that there are at most three girls (i.e., there may be 0, 1, 2, or 3 girls)? • What is the probability that there are more than two girls? Using IT to Find a Range of Binomial Probabilities
As you studied the binomial distributions and looked at the histograms of binomial distributions on the previous pages, you probably observed that the distributions and histograms were similar to normal distributions. Therefore, it is fair to conclude that, in certain cases, a binomial distribution is a reasonable approximation of a normal distribution.Recall: In a binomial distribution, we used values for 'n' and 'p' to solve problems, where: • n = number of trials, and • p = probability of success • In a normal distribution, we used values for 'm' and 's' to solve problems, where: • m = the population mean, and • s = the standard deviation Normal Approximation to the Binomial Distribution
We now want to use the normal approximation of a binomial distribution. The distribution will be approximately normal if:np ³ 5 and nq ³ 5The values of m and s are: Normal Approximation to the Binomial Distribution (cont’d)
Border patrol officers estimate that 10 percent of the vehicles crossing the US - Canada border carry undeclared goods. One day the officers searched 350 randomly selected vehicles. What is the probability that 40 or more vehicles carried undeclared goods?Solution:First check for the normal approximation to a binomial distribution.np = (350)(0.10) = 35nq = (350)(0.90) = 315Therefore, the approximation is reasonably close to a normal distribution because:np ³ 5 and nq ³ 5 Example: Solve a Binomial Distribution Problem as a Normal Distribution Problem
Calculate the mean and standard deviation: P(x ³ 40) = 0.186Therefore, there is about an 18.6 percent chance that 40 or more vehicles were carrying undeclared goods. Example: Solve a Binomial Distribution Problem as a Normal Distribution Problem (cont’d)
Sample Problem: Solve as a Binomial Distribution and Normal Distribution
Sample Problem: Solve as a Binomial Distribution and Normal Distribution
Sample Problem: Solve as a Binomial Distribution and Normal Distribution
Sample Problem: Solve as a Binomial Distribution and Normal Distribution
Sample Problem: Solve a Binomial Problem as a Normal Distribution Problem