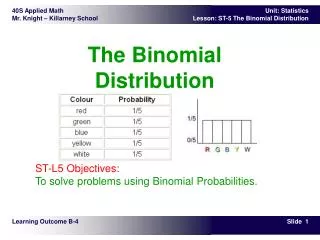
The Binomial Distribution
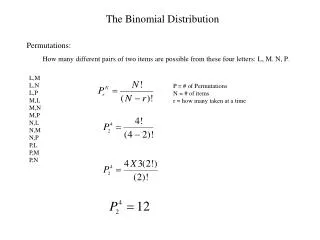
The Binomial Distribution. If a coin is tossed 4 times the possibilities of combinations are HHHH HHHT, HHTH, HTHH, THHHH HHTT,HTHT, HTTH, THHT, THTH, TTHH HTTT, THTT, TTHT, TTTH TTTT The pattern is 1, 4, 6, 4, 1 which follows Pascal’s triangle. Binomial distribution.

The Binomial Distribution
E N D
Presentation Transcript
If a coin is tossed 4 times the possibilities of combinations are • HHHH • HHHT, HHTH, HTHH, THHHH • HHTT,HTHT, HTTH, THHT, THTH, TTHH • HTTT, THTT, TTHT, TTTH • TTTT • The pattern is 1, 4, 6, 4, 1 which follows Pascal’s triangle
Binomial distribution Take the example of 5 coin tosses. What’s the probability that you flip exactly 3 heads in 5 coin tosses?
Binomial distribution Solution: One way to get exactly 3 heads: HHHTT What’s the probability of this exact arrangement? P(heads)xP(heads) xP(heads)xP(tails)xP(tails) =(1/2)3x(1/2)2 Another way to get exactly 3 heads: THHHT Probability of this exact outcome = (1/2)1x (1/2)3x(1/2)1 = (1/2)3x(1/2)2
Binomial distribution In fact, (1/2)3x(1/2)2 is the probability of each unique outcome that has exactly 3 heads and 2 tails. So, the overall probability of 3 heads and 2 tails is: (1/2)3x(1/2)2 + (1/2)3x(1/2)2+ (1/2)3x(1/2)2+ ….. for as many unique arrangements as there are—but how many are there??
Outcome Probability THHHT (1/2)3x (1/2)2 HHHTT (1/2)3x (1/2)2 TTHHH (1/2)3x(1/2)2 HTTHH (1/2)3x(1/2)2 HHTTH (1/2)3x (1/2)2 HTHHT (1/2)3x (1/2)2 THTHH (1/2)3x (1/2)2 HTHTH (1/2)3x (1/2)2 HHTHT (1/2)3x (1/2)2 THHTH (1/2)3x (1/2)2 10 arrangements x (1/2)3x (1/2)2 The probability of each unique outcome (note: they are all equal) ways to arrange 3 heads in 5 trials 5C3 = 5!/3!2! = 10 Factorial review: n! = n(n-1)(n-2)…
P(3 heads and 2 tails) = x P(heads)3 x P(tails)2 = 10 x (½)5=31.25%
Binomial Probability Distribution • A fixed number of observations (trials), n • e.g., 15 tosses of a coin; 20 patients; 1000 people surveyed • A binary outcome • e.g., head or tail in each toss of a coin; disease or no disease • Generally called “success” and “failure” • Probability of success is p, probability of failure is 1 – p • Constant probability for each observation • e.g., Probability of getting a tail is the same each time we toss the coin
Binomial distribution function:X= the number of heads tossed in 5 coin tosses p(x) p(x) x 0 1 3 4 5 2 number of heads number of heads
n = number of trials 1-p = probability of failure p = probability of success X = # successes out of n trials Binomial distribution, generally Note the general pattern emerging if you have only two possible outcomes (call them 1/0 or yes/no or success/failure) in n independent trials, then the probability of exactly X “successes”=
Binomial distribution: example • If I toss a coin 20 times, what’s the probability of getting exactly 10 heads?
Note: the variance will always lie between 0*N-.25 *N p(1-p) reaches maximum at p=.5 P(1-p)=.25 **All probability distributions are characterized by an expected value and a variance: IfX follows a binomial distribution with parameters n and p: X ~ Bin (n, p) Then: E(X) = np Var (X) = np(1-p) SD (X)=
Practice Problem • 1. You are performing a cohort study. If the probability of developing disease in the exposed group is .05 for the study duration, then if you (randomly) sample 500 exposed people, how many do you expect to develop the disease? Give a margin of error (+/- 1 standard deviation) for your estimate. • 2. What’s the probability that at most 10 exposed people develop the disease?
Answer 1. How many do you expect to develop the disease? Give a margin of error (+/- 1 standard deviation) for your estimate. X ~ binomial (500, .05) E(X) = 500 (.05) = 25 Var(X) = 500 (.05) (.95) = 23.75 StdDev(X) = square root (23.75) = 4.87 25 4.87
Answer 2. What’s the probability that at most 10 exposed subjects develop the disease? This is asking for a CUMULATIVE PROBABILITY: the probability of 0 getting the disease or 1 or 2 or 3 or 4 or up to 10. P(X≤10) = P(X=0) + P(X=1) + P(X=2) + P(X=3) + P(X=4)+….+ P(X=10)=
Practice Problem: You are conducting a case-control study of smoking and lung cancer. If the probability of being a smoker among lung cancer cases is .6, what’s the probability that in a group of 8 cases you have: • Less than 2 smokers? • More than 5? • What are the expected value and variance of the number of smokers?
0 7 1 2 3 4 5 6 8 Answer
P(>5)=.21+.09+.0168 = .3168 P(<2)=.00065 + .008 = .00865 0 7 1 2 3 4 5 6 8 Answer, continued E(X) = 8 (.6) = 4.8 Var(X) = 8 (.6) (.4) =1.92 StdDev(X) = 1.38
Review Question 4 In your case-control study of smoking and lung-cancer, 60% of cases are smokers versus only 10% of controls. What is the odds ratio between smoking and lung cancer? • 2.5 • 13.5 • 15.0 • 6.0 • .05
Review Question 4 In your case-control study of smoking and lung-cancer, 60% of cases are smokers versus only 10% of controls. What is the odds ratio between smoking and lung cancer? • 2.5 • 13.5 • 15.0 • 6.0 • .05
Review Question 5 What’s the probability of getting exactly 5 heads in 10 coin tosses?
Review Question 5 What’s the probability of getting exactly 5 heads in 10 coin tosses?
Review Question 6 A coin toss can be thought of as an example of a binomial distribution with N=1 and p=.5. What are the expected value and variance of a coin toss? • .5, .25 • 1.0, 1.0 • 1.5, .5 • .25, .5 • .5, .5
Review Question 6 A coin toss can be thought of as an example of a binomial distribution with N=1 and p=.5. What are the expected value and variance of a coin toss? • .5, .25 • 1.0, 1.0 • 1.5, .5 • .25, .5 • .5, .5
Review Question 7 If I toss a coin 10 times, what is the expected value and variance of the number of heads? • 5, 5 • 10, 5 • 2.5, 5 • 5, 2.5 • 2.5, 10
Review Question 7 If I toss a coin 10 times, what is the expected value and variance of the number of heads? • 5, 5 • 10, 5 • 2.5, 5 • 5, 2.5 • 2.5, 10
Review Question 8 In a randomized trial with n=150, the goal is to randomize half to treatment and half to control. The number of people randomized to treatment is a random variable X. What is the probability distribution of X? • X~Normal(=75,=10) • X~Exponential(=75) • X~Uniform • X~Binomial(N=150, p=.5) • X~Binomial(N=75, p=.5)
Review Question 8 In a randomized trial with n=150, every subject has a 50% chance of being randomized to treatment. The number of people randomized to treatment is a random variable X. What is the probability distribution of X? • X~Normal(=75,=10) • X~Exponential(=75) • X~Uniform • X~Binomial(N=150, p=.5) • X~Binomial(N=75, p=.5)
Review Question 9 In the same RCT with n=150, if 69 end up in the treatment group and 81 in the control group, how far off is that from expected? • Less than 1 standard deviation • 1 standard deviation • Between 1 and 2 standard deviations • More than 2 standard deviations
Review Question 9 In the same RCT with n=150, if 69 end up in the treatment group and 81 in the control group, how far off is that from expected? • Less than 1 standard deviation • 1 standard deviation • Between 1 and 2 standard deviations • More than 2 standard deviations Expected = 75 81 and 69 are both 6 away from the expected. Variance = 150(.25) = 37.5 Std Dev 6 Therefore, about 1 SD away from expected.
Proportions… • The binomial distribution forms the basis of statistics for proportions. • A proportion is just a binomial count divided by n. • For example, if we sample 200 cases and find 60 smokers, X=60 but the observed proportion=.30. • Statistics for proportions are similar to binomial counts, but differ by a factor of n.
Differs by a factor of n. Differs by a factor of n. P-hat stands for “sample proportion.” Stats for proportions For binomial: For proportion:
It all comes back to normal… • Statistics for proportions are based on a normal distribution, because the binomial can be approximated as normal if np>5