The Binomial Distribution
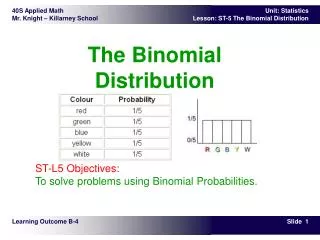
The Binomial Distribution. ST-L5 Objectives: To solve problems using Binomial Probabilities. Learning Outcome B-4. Normal Distributions deal with Continuous Data, and typically analyze how individual observations deviate from central values.

The Binomial Distribution
E N D
Presentation Transcript
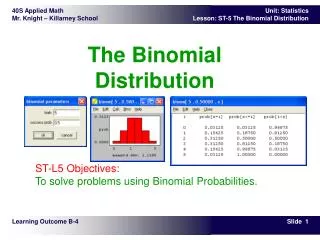
The Binomial Distribution ST-L5 Objectives:To solve problems using Binomial Probabilities. Learning Outcome B-4
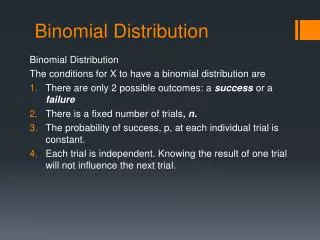
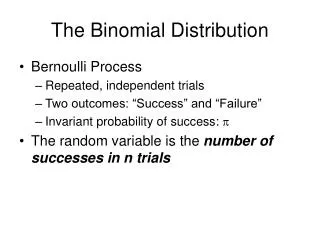
Normal Distributions deal with Continuous Data, and typically analyze how individual observations deviate from central values. • Binomial Distributions deal with Discrete Data. A binomial experiment has the following properties • The experiment consists of n repeated trials. • Each trial can result in just two possible outcomes. We call one of these outcomes a success and the other, a failure. • The probability of success, denoted by p, is the same on every trial. • The trials are independent; that is, the outcome on one trial does not affect the outcome on other trials. Theory – Characteristics of a Binomial Distribution
Consider the following statistical experiment. • You flip a coin 32 times and count the number of times the coin lands on heads. • This is a binomial experiment because: • The experiment consists of repeated trials. We flip a coin 32 times. • Each trial can result in just two possible outcomes - heads or tails. • The probability of success is constant - 0.5 on every trial. • The trials are independent; that is, getting heads on one trial does not affect whether we get heads on other trials. Example – Identifying a Binomial Distribution
When dealing with Binomial Distributions, we attend to a number of parameters n = the number of trials p = the probability of success q = the probability of failure = 1 - p x = the number of successes in n trials, and 0 £ x £ n P(x) = probability of getting exactly x successes in n trials {The value of P(x) is the solution that we are after} Note that the value 'x' always represents the same kind of outcome as 'p'. Theory - Notation Used in Binomial Problems
A manufacturer produces 24 yard alarms per week. Six percent of all the alarms produced are defective. What is the probability of getting two defective alarms in one week? First things first: Identify your parameters n = the number of trials n = 24 p = the probability of success p = 0.06 q = the probability of failure = 1 - p q = 0.94 x = the number of successes in n trials, and 0 £ x £ n x = 2 P(x)= probability of getting exactly x successes in n trials P(x) = ? Theory - Using IT to Find a Binomial Probability
A manufacturer produces 24 yard alarms per week. Six percent of all the alarms produced are defective. What is the probability of getting two defective alarms in one week? • Solution using Winstats. • Select Windows > Probability > Binomial… A new window should open. • In the new window Edit > Parameters. A new small window should open. • In the parameters window, enter: trials = 24 prob = 0.06 • Select Calc > Table in the Binom[ window. A new window showing a probability table should open. You can use this table to answer any binomial probability question. Theory - Using IT to Find a Binomial Probability
As shown on the table, the probability of having two faulty alarm systems is 0.255,i.e., P(x = 2) = 0.25470. This means that there is a 25.5 percent chance of having two faulty alarm systems in one week. Theory - Using IT to Find a Binomial Probability
There are five children in a family. Assume that boys and girls are equally likely. • What is the probability that three are girls? • What is the probability that there are at most three girls (i.e., there may be 0, 1, 2, or 3 girls)? • What is the probability that there are more than two girls? Using IT to Find a Range of Binomial Probabilities
End Day 1 do q. 1-7 Sample Binomial Problem (3)
The histograms of (some of) the binomial distributions on the previous pages looked similar to normal distributions. Therefore, it is fair to conclude that, in certain cases, a binomial distribution can be reasonable approximated by a normal distribution. Normal Not Normal Normal Approximation to the Binomial Distribution
Recall: In a binomial distribution, we used values for n and p to solve problems, where: n = number of trials, and p = probability of success In a normal distribution, we used values for m and s to solve problems, where: m = the population mean, and s = the standard deviation Normal Approximation to the Binomial Distribution
If certain conditions exist, a binomial distribution will be approximately normal. Check to see that np ³ 5 and nq ³ 5If these conditions exist, then the binomial distribution can be described by a normal distribution which has values of m = np and s= npq Normal Approximation to the Binomial Distribution (cont’d)
Border patrol officers estimate that 10 percent of the vehicles crossing the US - Canada border carry undeclared goods. One day the officers searched 350 randomly selected vehicles. What is the probability that 40 or more vehicles carried undeclared goods?Solution:First check for the normal approximation to a binomial distribution.np = (350)(0.10) = 35nq = (350)(0.90) = 315Therefore, the approximation is reasonably close to a normal distribution because:np ³ 5 and nq ³ 5 Example: Solve a Binomial Distribution Problem as a Normal Distribution Problem
Then, calculate the mean and standard deviation, and solve using your normal distribution techniques: P(x ³ 40) = 0.186Therefore, there is about an 18.6 percent chance that 40 or more vehicles were carrying undeclared goods. Example: Solve a Binomial Distribution Problem as a Normal Distribution Problem (cont’d)
Sample Problem: Solve as a Binomial Distribution and Normal Distribution
Sample Problem: Solve as a Binomial Distribution and Normal Distribution
Sample Problem: Solve as a Binomial Distribution and Normal Distribution
Sample Problem: Solve as a Binomial Distribution and Normal Distribution
Sample Problem: Solve a Binomial Problem as a Normal Distribution Problem