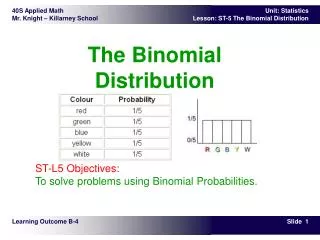
Binomial Distribution
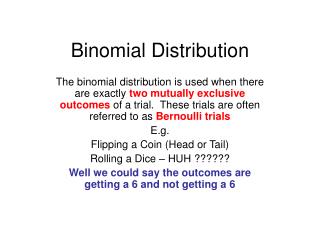
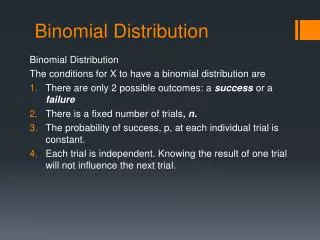
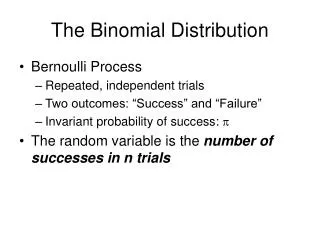
Binomial Distribution. Recall that for a binomial distribution, we must have:. Two possible outcomes, called success and failure. Constant probability. Independent trials. A fixed number of trials.


Binomial Distribution
E N D
Presentation Transcript
Recall that for a binomial distribution, we must have: • Two possible outcomes, called success and failure • Constant probability • Independent trials • A fixed number of trials
Ex 1: Consider the random event with two possible outcomes, such as heads and tails, from tossing a coin. Each toss is independent of every other toss and probability is constant. Suppose we define X to be the number of heads in a series of 4 tosses. What possible values can X take on? X can be {0,1,2,3,4}.
We can find the probabilities by listing the possible outcomes and counting: HHHH HHHT HHTH HHTT HTHH HTHT HTTH HTTT THHH THHT THTH THTT TTHH TTHT TTTH TTTT X 0 1 2 3 4 P(X) 1/16 4/16 6/16 4/16 1/16 The binomial formula is: We can confirm the probabilities found above.
We can find the probabilities by listing the possible outcomes and counting: The binomial formula is: We can confirm the probabilities found above.
One thing that makes the binomial formula so nice to use is that the graphing calculator has this formula programmed already! Let’s try this on the calculator. Enter {0,1,2,3,4} into L1. You can do this from the homescreen or from within lists. Enter the probabilities in L2 using the command binompdf(4,0.5, L1).
The values are the same as we found from listing the outcomes or using the formula by hand. We can use this same process to find a single value. To find the binomial probability for n = 6, p = 0.2, X = 3, use the command binompdf(6,.2,3). The probability is .08192.
You should know how to use the formula, but as a practical matter, the calculator is fine. See that we can make a single calculation readily using binompdf. Pdf stands for probability density function. When dealing with discrete distributions like the binomial, a calculation of a pdf will give us a probability.
When working with a continuous distribution, such as the normal distribution, we used a cdf or continuous density function, to find an area under the curve. We can also use a cdf with the binomial distribution, but the calculator defines it a little differently. It sums all the probabilities for X = 0 up to X = the given value of X. If you want to find the probability for having up to 4 girls in a family of 5 children, we have n = 5, p = .5, X ≤ 4. Try the command binomcdf(5,.5,4). P(X ≤ 4) = .9687.
Going back to the earlier example using the coin toss, check your calculator. Have {0,1,2,3,4} in L1 and the binompdf values in L2. Now enter binomcdf(4,.5,L1) into L3. Now let’s look at the lists. The values of X are in L1. The probability of each vales is in L2. Now the sum of each probability (a cumulative sum) is in L3. In fact, the cumSum(L2) command will give the same values as the binomcdf.
When working a binomial problem I usually suggest that students make a simple number line to aid in finding which values to include. It sounds unnecessary, but really it is often needed to avoid mistakes. Ex 2: Find the probability of getting at most 4 out of 10 true and false problems correct by guessing (assume T and F are equally likely). Answer: The possible values of X are 0,1,2,3,…,10. 0 1 2 3 4 5 6 7 8 9 10 “At most 4” tells us that we could have {0,1,2,3,4}. Use the command binomcdf(10,.5,4)=.3769.
0 1 2 3 4 5 6 7 8 9 Ex 3: Find the probability of making 5 or more baskets out of 9 shots, for an 80% free throw shooter in basketball. Answer: The possible values of X are {0,1,2,3,…,9}. “5 or more” tells us that we could have {5,6,7,8,9}. To find this quantity we use the binomial command on the calculator. 1- binomcdf(9,.8,4)= .9804.
0 1 2 3 4 5 6 7 8 9 Nex 4: Find the probability of missing 5 or more baskets out of 9 shots, if you are an 80% free throw shooter in basketball. Answer: The possible values of X are {0,1,2,3,…,9}. Missing 5 or more means hitting only 0,1,2,3,or 4. To find this quantity we use binomcdf(9,.8,4)= .01954.
You are now ready to work problems on your own. Make sure to draw numberlines whenever there are inequalities. You’d be surprised at how easy it is to make a mistake without the numberline.