Binomial Distributions
Binomial Distributions. Section 6.2: How Can We Find Probabilities When Each Observation Has Two Possible Outcomes?. Binomial Distributions. B inomial distributions are based on categorical data with only two possible responses. Examples Did you pass the test Have a car


Binomial Distributions
E N D
Presentation Transcript
Binomial Distributions Section 6.2: How Can We Find Probabilities When Each Observation Has Two Possible Outcomes?
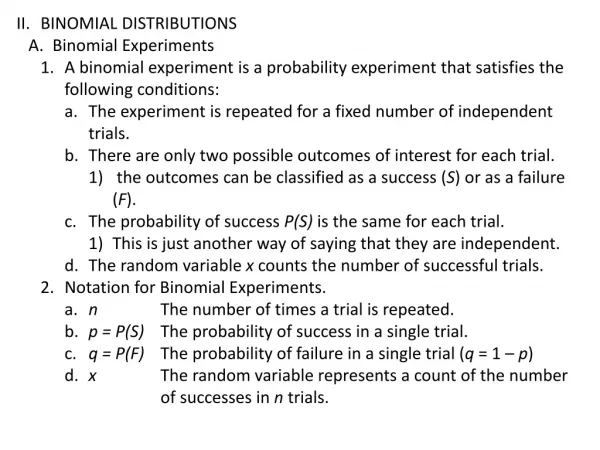
Binomial Distributions • Binomial distributions are based on categorical data with only two possible responses. • Examples • Did you pass the test • Have a car • Are you north or south of the equator • Which court is a case going through (federal/state) • One response will be called a “success” the other a “failure”.
Conditions: • Each trial must be independent. • Asking one person can’t effect others answers. • The probability for each trial must be the same. • Notation: • Let n = the number of trials • Let p = the probability of success • Let q = the probability of failure • Let X be the random variable for the number of successes for n trials.
Conditions: • Let X be the random variable for the number of successes for n trials.
Example; • P(5) would be the probability of getting 5 success in a given number of trials. • P(10) would be the probability of getting 10 success in a given number of trials. • P(0) would be the probability of getting no success in a given number of trials.
Lets try, • I’m going to guess the card you draw from the deck. (replace the cards between trials) • We are going to try this 3 times. • How likely is it I will get exactly one right? • How likely I get more then one right?
Lets try, • I’m going to guess the card you draw from the deck. • We are going to try this 3 times. • How likely is it I will get exactly one right? • How likely I get more then one right? • Notation; • n = • p = • q = • X is the number of successes in three trials, either 0, 1, 2, or 3. • Goal; • Find P(1) and P(2 or 3) 3 1/52 51/52
Finding probabilities; (old school) • List the sample space; • FFF, SFF, FSF, FFS, SSF, SFS, FSS, SSS • Which correspond to one success, x = 1? • SFF, FSF, FFS • What are their probabilities? • P(SFF) = P(S and F and F) = P(S) x P(F) x P(F) = (1/52) x (51/52) x (51/52) = 0.0185 • P(FSF) = P(F) x P(S) x P(F) = q x p x q = (51/52) x (1/52) x (51/52) = 0.0185 • P(FFS) = q x q x p = (51/52) x (51/52) x (1/52) = 0.0185 • There sum is (0.0185) + (0.0185) + (0.0185) = 0.0555 or 5.55% • Notice this is 3(p)(q²)
Parts: 3(p)(q²) A q for each failure we want. The number of ways our goal could happen. A p for each success we need For two successes; It can happen three ways, SSF, SFS, FSS, So, 3(p²)(q) = 3(1/52)²(51/52)
Try three; • Three right guesses of your card can only happen one way, SSS. • So, 1(1/52)³(51/52)º = • In general we have, Number of ways that combination happens
Listing the sample Space? • For a small number of trials, like three, we can list the sample space relatively fast and see how many ways the successes and failures come up. FFF, SFF, FSF, FFS, SSF, SFS, FSS, SSS We could even do it for four; FFFF, SFFF, FSFF, FFSF, FFFS, SSFF, SFSF, SFFS, FSSF, FSFS, FFSS, SSSF, SSFS, SFSS, FSSS, SSSS Or how about five trials; “Put list of the 32 combination here”
Listing the sample space? • When you go survey people you are asking 30, 40, even 100 people, that’s 100 trials. Billons of trillions of combinations!!! 1,267,657,368,594,201,568,956,327,459,028 We need a tool!!
Combinatorics; • How many ways can x successes be distributed over n trials? • Note: ! Refers to the factorial operation.
The What? • Factorials find the product of all counting numbers less then or equal to the number given. What?? So, 5! = 1 x 2 x 3 x 4 x 5 = 120 7! = 1 x 2 x 3 x 4 x 5 x 6 x 7 = 5040
Finding the Ways; • So, for n=5 and x=3, • Thus of the 32 ways to combine 5 trials, ten of them have three successes.
Our formula; For; n trials p probability of success q probability of failure (1-p) X number of successes Use tech:
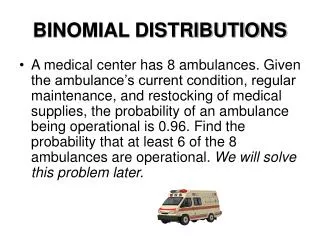
Example; • 60% of Americans are overweight. If you gather 15 random people what is the likelihood 10 will be overweight?
Finding Means and Standard deviations for binomial distributions; More formula;
Example of μ and σ; • So, given that 60% of Americans are overweight how many would you expect to find in a group of 15 random people? • μ = np = 15(0.60) = 9 • With • We can use our normal distribution tools here under special conditions. • If npq is larger than 15 [ten really] we may use normal distribution to examine our probabilities of being in an interval.
Example, (last one) • You play a game “many” times and find that you win 73% of the time. You want to know in a set of 50 games how many will you usually win. • On average you will win, μ = 50(0.73) = 36.5 games. • But, your standard deviation is 3.14 • So you will usually fall between 36.5+2(3.14) and 36.5-2(3.14) • Therefore you should expect to win between 30.22 and 42.78 games. • If you wanted to find where ALL of your wins should fall use three S.D.s.