4.2 Binomial Distributions
4.2 Binomial Distributions. Determining binomial experiments Finding binomial probabilities using binomial probability formula, technology, or tables Graph a binomial distribution Find mean, variance, and standard deviation. Binomial Experiment.

4.2 Binomial Distributions
E N D
Presentation Transcript
4.2 Binomial Distributions Determining binomial experiments Finding binomial probabilities using binomial probability formula, technology, or tables Graph a binomial distribution Find mean, variance, and standard deviation
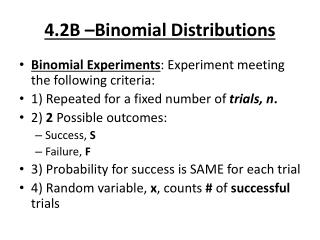
Binomial Experiment A binomial experiment is a probability experiment that satisfies the following conditions. The experiment is repeated for a fixed number of trials, where each trail is independent of the other trials. There are only two possible outcomes of interest for each trial. The outcomes can be classified as a success (S) or as a failure (F). The probability of a success P(S) is the same for each trial. The random variable x counts the number of successful trials.
Try it yourself 1 • Identifying and Understanding Binomial Experiments Decide whether the following is a binomial experiment. If it is, specify the values of n, p, and q, and list the possible values of the random variable x. If it is not, explain why.
Try it yourself 1 • Identifying and Understanding Binomial Experiments You take a multiple-choice quiz that consists of 10 questions. Each question has four possible answers, only one of which is correct. To complete the quiz, you randomly guess the answer to each question. The random variable represents the number of correct answers.
Try it yourself 1 Trial: answering a question Success: question answered correctly n = 10 p = 0.25 q = 0.75 x = 0, 1, 2, 3, 4, 5, 6, 7, 8, 9, 10 This is a binomial experiment!!
Binomial Probability Formula In a binomial experiment, the probability of exactly x successes in n trials is P(x) =
Try it yourself 2 • Finding Binomial Probabilities A card is selected from a standard deck and replaced. This experiment is repeated a total of five times. Find the probability of selecting exactly three clubs. Trail: drawing a card with replacement Success: card drawn is a club Failure: card drawn is not a club n = 5, p = 0.25, q = 0.75, x = 3 P(3) ≈ 0.088
Try it yourself 3 • Constructing a Binomial Distribution In a survey, U.S. adults were asked to give reasons why they liked texting on their cellular phones. Seven adults who participated in the survey are randomly selected and asked whether they like texting because it works where talking won’t do. Create a binomial distribution for the number of adults who responded yes.
Try it yourself 3 Trial: selecting an adult and asking a question Success: selecting an adult who likes texting because it works where talking won’t do Failure: selecting an adult who does not like texting because it works where talking won’t do n = 7, p = 0.75, q = 0.25, x = 0, 1, 2, 3, 4, 5, 6, 7
Try it yourself 4 • Finding a Binomial Probability Using Technology The results of a recent survey indicate that 71% of people in the United States use more than one topping on their hot dogs. If you randomly select 250 people, what is the probability that exactly 178 of them will use more than one topping? Use a technology tool to find the probability. 0.056
Try it yourself 5 • Finding Binomial Probabilities Using Formulas A survey indicates that 21% of men in the United States consider fishing their favorite leisure-time activity. You randomly select five U.S. men and ask them if fishing is their favorite leisure-time activity. • Find the probability that exactly two of them respond yes. 0.217
Try it yourself 5 • Find the probability that at least two of them respond yes. • Find the probability that fewer than two of them respond yes. 0.283 0.717
Try it yourself 6 • Finding a Binomial Probability Using a Table About fifty-five percent of all small businesses in the United States have a website. If you randomly select 10 small businesses, what is the probability that exactly four of them have a website? Use a table to find the probability. 0.160
Try it yourself 7 • Graphing a Binomial Distribution Eighty-one percent of households in the United States own a computer. You randomly select four households and ask if they own a computer. Construct a probability distribution for the random variable x. Then graph the distribution.
Population parameters of a binomial distribution Mean: μ =np Variance: σ² = npq Standard deviation: σ = √npq
Try it yourself 8 • Finding and Interpreting Mean, Variance, and Standard Deviation In San Francisco, California, 44% of the days in a year are clear. Find the mean, variance, and standard deviation for the number of clear days during the month of May. Interpret the results and determine any unusual events. μ = 13.6, σ² = 7.6, σ = 2.8