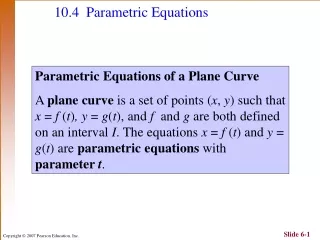
Parametric Equations for Visualizing Graphs
130 likes | 165 Vues
Learn how to write parametric equations in terms of a parameter ‘t’ to describe motion or curves that are not functions. Convert between parametric and Cartesian equations for diverse graph representations easily. Explore parametrization of line segments using practical examples.

Parametric Equations for Visualizing Graphs
E N D
Presentation Transcript
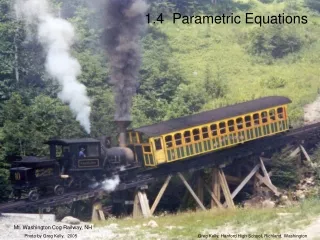
Photo by Greg Kelly, 2005 Greg Kelly, Hanford High School, Richland, Washington 10.1A Parametric Equations Mt. Washington Cog Railway, NH
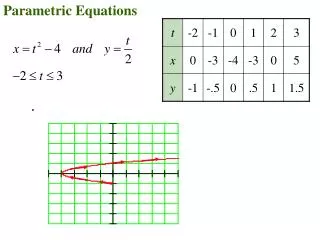
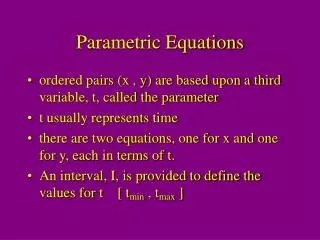
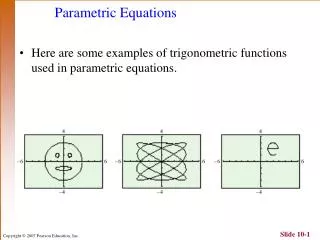
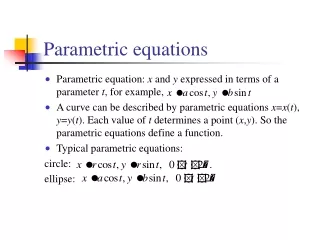
We can do this by writing equations for the x and y coordinates in terms of a third variable (usually t or ). There are times when we need to describe motion (or a curve) that is not a function. These are called parametric equations. “t” is the parameter. (It is also the independent variable)
Example 1: To graph on the TI-nspire: 3 3 Press menu Graph Entry/Edit Parametric Input formulas for x and y, the range for t, and the size of the step between points. Press enter (You will need to use the delete key.)
4 5 Press menu Window / Zoom Zoom - Standard We can confirm this algebraically: parabolic function
Circle: If we let t = the angle, then: Since: We could identify the parametric equations as a circle.
Graph on your calculator: menu 3 3 1 Window Settings trig To find the trig functions, use the key. Change the window settings. menu 4 Now square it up. menu 4 B Zoom - Square
You can watch the direction and relative velocity of the graph by using the trace function: menu 5 Trace Notice the x, y and t values displayed. Use the right and left arrow keys to watch the position change as t changes. 1 Graph Trace You can enter a specific value for t, like .
5 Trace 3 Holding a key down makes the motion continuous. Trace Step… Change the speed by changing the size of the steps: menu Smaller steps slow the graph down.
The TI-nspire can also graph conic sections directly without converting to parametric equations. 3 2 menu Graph Entry/Edit Equation 3 Circle 1 The horizontal and vertical shifts are zero, and the radius is 1.
Ellipse: This is the equation of an ellipse.
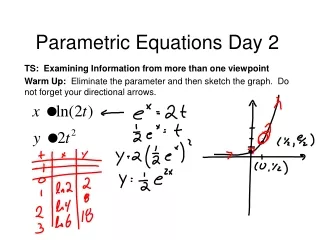
Converting Between Parametric and Cartesian Equations We have seen two techniques for converting from parametric to Cartesian: The first method is called eliminating the parameter. It requires solving one equation for t and substituting into the other equation to eliminate t. This is possible when the graph is a function. The second method used the Pythagorean identity to eliminate t by using the fact that . Both of these methods only work sometimes. There are many curves that can only be described parametrically.
On the other hand, changing from the Cartesian equation for a function to a parametric equation always works and it is easy! The steps are: 1) Replace x with t in the original equation. 2) Let x = t . Example: becomes:
In the special case where we want the parametrization for a line segment between two points, we could find the Cartesian equation first and then convert it to parametric, but there is an easier way. We will use an example to illustrate: Find a parametrization for the line segment with endpoints (-2,1) and (3,5). Using the first point, start with: Notice that when t = 0 you get the point (-2,1) . Substitute in (3,5) and t = 1 . The equations become: p