Project Scheduling
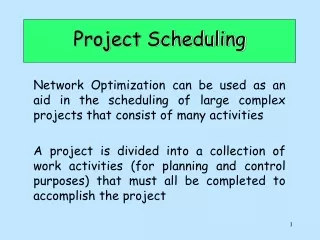
Project Scheduling. IENG 321. Outline. What is a “project”? Objectives and tradeoffs Planning and Control in Projects Scheduling Methods Constant-Time Networks Precedence Diagramming Method PERT and CPM Methods Use of Project Concepts. What is a “Project”?.

Project Scheduling
E N D
Presentation Transcript
Project Scheduling IENG 321
Outline • What is a “project”? • Objectives and tradeoffs • Planning and Control in Projects • Scheduling Methods • Constant-Time Networks • Precedence Diagramming Method • PERT and CPM Methods • Use of Project Concepts
What is a “Project”? • Distinguishing characteristics of projects • Example
Due Date! Stay within Meet the the budget deadline Meet the specifications Objectives and Tradeoffs
Planning Control Scheduling Project Project Management Activities and Decisions
Planning • Identify the project customer • Establish the end product or service • Set project objectives • Estimate total resources and time required • Decide on the form of project organization • Make key personnel appointments • Define major tasks required • Establish a budget
Scheduling • Develop a detailed work-breakdown structure • Estimated time required for each task • Sequence tasks in proper order • Develop a start/stop time for each task • Develop detailed budget for each task • Assign people to tasks
Control • Monitor actual time, cost, and performance • Compare planned to actual figures • Determine whether corrective action is needed • Evaluate alternative corrective actions • Take appropriate corrective action
Network Project Chart (Figure 14.2) 7 Secure outside sheathing 1 2 3 5 6 Pour footing 8 Dig basement Lay block foundation Install main floor Erect frame Install roof boards Finish rough-in frame Start 4 10 Finish below- grade work 9 Install windows
Constant-Time Networks • Activity times assumed to be constant • “Dummy” activities • Notations used in calculating start and finish times: • ES(a) = Early Start of activity a • EF(a) = Early Finish of activity a • LS(a) = Late Start of activity a • LF(a) = Late Finish of activity a
Network Diagram (Figure 14.3) 2 5 3 1 4 2 4 6 3 1 Event Activity
Dummy Activity Situations (Figure 14.4a) E H F G a. Activities F and G have the same predecessor (E) and the same successor (H)
Dummy Activity Situations (Figure 14.4b) C A E B D b. Activity A and B have a common predecessor (E), but they have different predecessors (C and D)
Dummy Activity Situations (Figure 14.4c) I C K D J c. Activities C and D have a common successor (K), but different successors (I and J)
Calculating ES, EF, LS, LF, and Completion Time Forward Pass: ES (a) = 0 for the starting activity EF (a) = ES (a) + t (a)* ES (a) = max [EF (all predecessors of a)] Project completion time = max [EF(all ending activities)] Backward pass: LF (a) = min [LS (all successors of a)] LS (a) = LF - t(a)* * t (a) denotes the duration of activity a
Slack Times • Total Slack Time (TST): LS (a) - ES (a) - EF (a)= LF(a) - EF(a) • Free Slack Time (FST) min [ES (all successors of a)] - EF (a)
Activity Start and Finish Times (Figure 14.5) 2 [3, 8] 5 [0, 3] 3 [3, 8] [0, 3] 4 [3, 5] 2 1 [4, 6] [0, 4] 4 [5, 7] 2 [2, 6] [6, 8] 3 [ES, EF] [LS, LF]
PDM Network (Figure 14.6) Activity 1-2 Activity 2-4 Activity 2-3 Activity 1-3 Activity 3-4
PDM Time Schedule (Figure 14.7) 2-4 1-2 2-3 Project Completion 1-3 3-4 0 1 2 3 4 5 6 7 8
SS = 2 A FS = 3 B A B Finish to Start Job B can start no sooner than 3 days after Job A is completed. Start to Start Job B can start no sooner than 2 days after Job A has started. SF = 6 A B A B FF = 4 Finish to Finish Job B can finish no sooner than 4 days after Job A was finished. Start to Finish Job B can finish no sooner than 6 days after Job A has started. PDM Precedence Relationship
Cement Floor Example (Figure 14.9) SS = 1 Pour cement Install forms FF = 0
Time-Cost Relationship in CPM Crash Cost Cost Normal Cost Crash Time Normal Time Time
Use of Project Management Concepts • Scheduling is only part of a complete approach to project management • Tradeoffs between sophistication and cost of methods • Choice between PERT, CPM, and PDM • Project management software