Download
1 / 10
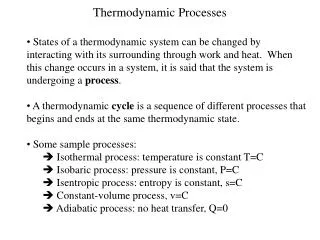
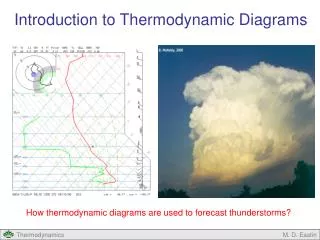
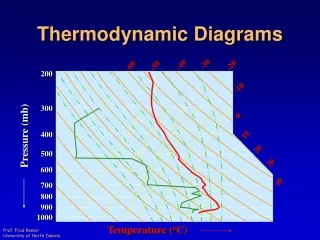
Atmospheric Stability and Moisture with Thermodynamic Diagrams
110 likes | 198 Vues
Explore how thermodynamic diagrams help identify stability, air masses, moisture levels, clouds, and atmospheric processes. Learn about Stuve (Pseudoadiabatic) and Skew-T diagrams, isobars, isotherms, and mixing ratio lines.
Télécharger la présentation 
Atmospheric Stability and Moisture with Thermodynamic Diagrams
An Image/Link below is provided (as is) to download presentation
Download Policy: Content on the Website is provided to you AS IS for your information and personal use and may not be sold / licensed / shared on other websites without getting consent from its author.
Content is provided to you AS IS for your information and personal use only.
Download presentation by click this link.
While downloading, if for some reason you are not able to download a presentation, the publisher may have deleted the file from their server.
During download, if you can't get a presentation, the file might be deleted by the publisher.
E N D
Presentation Transcript
Atmospheric Soundings Plotted on Thermodynamic Diagrams • Allow us to identify stability of a layer • Allow us to identify various air masses • Tell us about the moisture in a layer • Help us to identify clouds • Allow us to speculate on processes occurring

More Related