Thermodynamic Diagrams for Atmospheric Processes
560 likes | 601 Vues
Explore the key characteristics, advantages, and transformations involved in using thermodynamic diagrams to depict atmospheric processes. Learn about different types of diagrams and their applications.

Thermodynamic Diagrams for Atmospheric Processes
E N D
Presentation Transcript
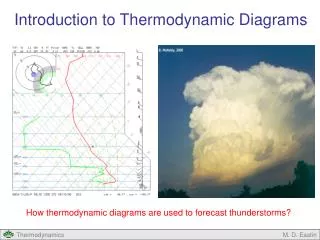
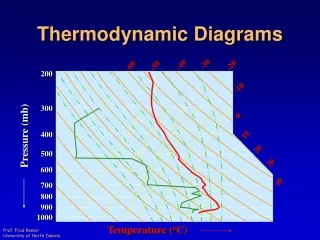
-30 -40 -20 -50 -60 200 -10 300 0 Pressure (mb) 400 10 20 500 30 600 40 700 800 900 1000 Temperature (oC) Thermodynamic Diagrams
Thermodynamic Diagrams • Reading • Hess • Chapter 5 • pp 65 – 74 • Tsonis • pp 143 – 150 • Air Weather Service,AWS/TR-79/006 • Wallace & Hobbs • pp 78 – 79
Thermodynamic Diagrams • Objectives • Be able to list the three desirable characteristics of a thermodynamic diagram • Be able to describe how a transformation is made from p, a coordinates when designing a thermodynamic diagram
Thermodynamic Diagrams • Objectives • Be able to list the coordinates of each thermodynamic diagram • Be able to describe the advantages and disadvantages of each thermodynamic diagram
Thermodynamic Diagrams • Provide a graphical representation of thermodynamic processes in the atmosphere
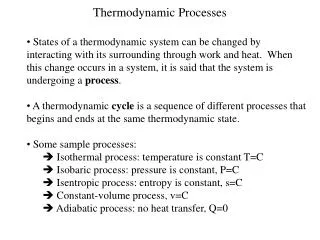
Thermodynamic Diagrams • Thermodynamic Processes? • Isobaric • Isothermal • Dry Adiabatic • Pseudoadiabatic • Constant Mass
Thermodynamic Diagrams • Thermodynamic Diagrams • Eliminates or simplifies calculations
Pressure (mb) Temperature (oC) Thermodynamic Diagrams • Most Simplistic 400 500 600 Temp. 700 800 Dew Point 900 1000 -20 -10 0 10 20 30
Pressure (mb) Temperature (oC) Thermodynamic Diagrams • Not very useful 400 500 600 Temp. 700 800 Dew Point 900 1000 -20 -10 0 10 20 30
Thermodynamic Diagrams • Desirable Characteristics • Area Equivalent • Area enclosed by a cyclic process is proportional to energy
-30 -40 -20 -50 -60 200 -10 300 0 Pressure (mb) 400 10 20 500 30 600 40 700 800 900 1000 Temperature (oC) Desirable Characteristics
Desirable Characteristics • As many isopleths as possible be straight lines
Temperature (oC) Desirable Characteristics -30 -40 -20 -50 -60 200 -10 300 0 Pressure (mb) 400 10 20 500 30 600 40 700 800 900 1000
Desirable Characteristics • The angle between isotherms and adiabats be as large as possible • Sensitivity to the rate of change of temperature with pressure in the vertical • Easier to determine stability of the environment • 90o Optimum
Temperature (oC) Desirable Characteristics -30 -40 -20 -50 -60 -10 0 Pressure (mb) 10 20 30 40
Coordinates • Select so that it satisfies Area Equivalent characteristic • Enclosed area is proportional to energy • Use p & a
Coordinates • Known as Clapeyron Diagram • Small angle between T & q q1 T1 q2 T2 P Dry Adiabats 1000 mb a
P A a B Coordinates • Equal Area Transformation • Consider two other variables A & B
P A a B Coordinates • Equal Area Transformation • Create a transformation from -p, a to A, B
P a Equal Area Transformation A B
Equal Area Transformation • Closed integral cannot equal zero unless it is an exact differential
Equal Area Transformation • Differentiate s with respect to a and B • So ...
Equal Area Transformation • Differentiate p with respect to B • Differentiate A with respect to a
Equal Area Transformation • Specify B, can determine A • Equal Area maintained
Emagram • Energy per Unit Mass Diagram • Set B = T
Emagram • Using the Ideal Gas Law • Differentiate
Emagram • Integrate
Emagram • Once again, the Equation of State • Take the natural logarithm
Emagram • Substitute
Emagram • Select f(t) such that • Finally … coordinates A & B are …
Emagram 400 mb 100oC 80oC qe 60oC 600 mb 40oC Pressure 20oC w q = 0oC 800 mb -20oC 1000 mb -40oC -20oC 0oC 20oC 40oC Temperature
Emagram • Area proportional to energy • Four sets of straight (or nearly straight) lines • 45o angle between adiabats and isotherms
Tephigram • T- f Diagram • Temperature = T • Entropy = f
Tephigram • Coordinates • Similar to Emagram • Different constant of integration
Tephigram • Evaluate f(T) using Potential Temperature • Ideal Gas Law • Substitute for p
Tephigram • Take the natural logarithm
Tephigram • Solve for lna
Tephigram • Solve for lna
Tephigram • Select f(T) • Substitute
Tephigram • Substitute • Since g(T) = -f(T)
Tephigram • Coordinates • Similar to Emagram
Tephigram Temperature -20oC -40oC 400 mb 60oC 0oC qe 40oC 600 mb Pressure 20oC 800 mb w q = 0oC 1000 mb
Tephigram • Area proportional to energy • Four sets of straight (or nearly straight) lines • Isobars Curved! • 90o angle between adiabats and isotherms
Skew-T Log-P • Modified Emagram • Isotherm-Adiabat angle 90o • Set B = -R lnp
Skew-T Log-P • But... • So ... • Becomes ..
Skew-T Log-P • Multiply both sides by da
Skew-T Log-P • Integrate • Ideal Gas Law
Skew-T Log-P • Select f(lnp) K = arbitrary constant
Skew-T Log-P • Coordinates • Similar to Emagram