Measuring biodiversity
240 likes | 314 Vues
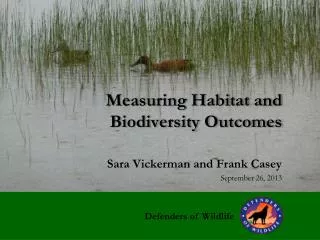
Measuring biodiversity. Dr RJ (Bob) Scholes Chair, Global Terrestrial Observing System CSIR Environmentek PO Box 395, Pretoria 0001, South Africa bscholes@csir.co.za. This paper will cover…. Theory of biodiversity observations Existing approaches and systems

Measuring biodiversity
E N D
Presentation Transcript
Measuring biodiversity Dr RJ (Bob) Scholes Chair, Global Terrestrial Observing System CSIR Environmentek PO Box 395, Pretoria 0001, South Africa bscholes@csir.co.za
This paper will cover… • Theory of biodiversity observations • Existing approaches and systems • Approaches that may satisfy the goals
Biodiversity: 3 aspects x 3 levels Structural Landscape patterns Physiognomy/habitat structure (Noss 1994) Population structure Genetic structure Genetic process Genes Demographicprocess Compositional Interspecific interactions Species, populations Functional Landscapeprocesses/ disturbances/ Communities/ecosystems Landscape type
At any level, diversity has at least two components… • How many different types of things are present • Elephant, rhino and lion is less diverse than • Elephant, rhino, lion, leopard and buffalo • How evenly they are represented • 1000 elephants and 1 lion is less diverse than • 500 elephants and 500 lions
‘Academic’ ways of measuring biodiversity Species level • Richness: Total number of species in an area ( diversity) • Species turnover along a gradient ( diversity) Ecosystem level • Number of different habitats or ecosystems ( diversity) Genetic level • Genetic homology • Cladistic distance
‘Policy’ ways of measuring biodiversity • ‘Extinction based’ (IUCN) • Threatened species (Red Data Books) • ‘Area based’(Millennium goals) • Area under protection • Area of a key habitat (eg Forest cover) • ‘Richness based’ • Indicator groups or species eg CI Rapid Biodiversity Assessment • Complementarity –based • Various conservation optimisation tools, eg CPLAN • Various spatial representations • Hotspots, last wild places
Royal Society Report2003 • ‘… no sound basis exists for assessing performance against these targets.’ • ‘The fate of organisms not yet recognised by science cannot be measured’ • Lack of baselines • Biodiversity measures must be related to the objectives of measurement
Attributes of a good indicator • Does it measure what it says it does? • Sensitive, but not oversensitive • Scale appropriate in time and space • Well-understood model • Reliable data available • Monitoring systems in place • Understandable by policymakers (NRC 2000)
Natural Capital IndexRIVM/UNEP-WCMC/GEO-3 NCI = ecosystemquality x ecosystem quantity
SAMA* Biodiversity Intactness Index Millennium Ecosystem Assessment Strengthening Capacity to Manage Ecosystems Sustainably for Human Well-Being • Based on impacts on populations, rather than extinctions • Considers a range of impacts • Protected, sustainably used, unsust used, partially transformed, transformed • Scale independent • Applicable now, but amenable to incremental improvement *Southern Africa Millennium Ecosystem Assessment
SAMA Algorithm B = biodiversity intactness index Cijk = populations of i under use k/ popn when protected Ajk= Area of land use k in ecosystem j Rij = Richness of taxon i in ecosystem j i= taxon, from 1 to t j= ecosystem, from 1 to m k= land use type, from 1 to n Needs: Land cover, richness, impact matrix
WWF Ecoregion database 867 biodiversity-based regions of the world Based on best available information Species lists for birds, mammals, reptiles, plants,amphibia
Global land cover products • Many are now available • DISCover, FAO-FRA, GLC 2000, Modis… • Global coverage, resolution < 1 km • 20 m products available for key areas • Methods and results convergence • GOFC/GOLD (a GTOS panel) • Mid 1990s baselines feasible, year 2000 baseline in hand • Reliable expectation of year 2010 repeat
What GTOS can offerGlobal Terrestrial Observing System • Biodiversity is one of the five mandated topics covered by GTOS • Land, freshwater, cryosphere • Close collaboration with GOOS on coasts • GOOS covers open ocean • TEMS database • ‘biodiversity module’ • Biodiversity network: methods harmonised • GOFC/GOLD • Land cover dynamics, especially forests
Web directory of 1,600 sites and 55 networks in 110 countries that carry out long-term terrestrial ecosystem monitoring of 110 variables TEMS: Terrestrial Ecosystem Monitoring Sites Who, what, where http://www.fao.org/gtos/tems
TEMS Biodiversity module Variables specific to biodiversity: • Colonization of habitat by invasive species • Habitat conversion • Habitat fragmentation • Indicator species • Pollinator species • Species Richness • Threatened Species Many of the other 115 variables in TEMS are also directly linked to Biodiversity.
The CBD and WSSD goalsCBD CoP VII/26, WSSD Implementation Plan Rate 1 Rate 2 Biodiversity rate 2 < rate 1 1990 2000 2010 • ‘..significantly reduce the rate of loss of biodiversity by 2010…’ • This is a ‘double differential’ problem • Change in a rate • Requires at least 3 snapshots in time to solve
Global strategy for plant conservationCBD CoP VI/9 April 2002 • Accessible list of plant species… • Assess status of all species… • Understand conservation needs for threatened species… • 10% of each ecological region, 50% of species conserved in situ • 90% threatened species cons ex situ • 30% of production lands managed consistent with conservation goals
UN Millennium Goals • ‘…reverse the loss of environmental resources…’ • Proposed indicators: • Proportion of land area covered by forest • Proportion of land area protected for biodiversity conservation • These indicators are measurable, but not necessarily sensitive to the goal
Pragmatic issues… • For the purpose of evaluating progress towards the goals, biodiversity measurements • Don’t have to be perfect, just agreed • Need to be based on ‘activity’ rather than ‘stock’ measurements (cf UNFCCC) • Satellite-based land cover measurements, coupled with ‘sparse’ in-situ information in an explicit way (a ‘model’) could do the job for terrestrial systems
A proposal Agree to develop an approach based on • Land cover/use in 1995, 2000, 2005 and 2100 [GOFC/GOLD + WCMC] • Richness within ecosystem units [WWF + Taxonomy initiatives+ NGOs + nations] • An impact matrix (land use x taxa, per biome) derived from site data, models and expert judgement [ Diversitas + GTOS] For test by 2005, and retrospective application by 2010