Exploring Biodiversity Patterns in Time and Space
Learn about measuring biodiversity through genetic, species, and taxonomic diversity assessments, surveys, and observing patterns in time and space. Understand the importance for conservation.

Exploring Biodiversity Patterns in Time and Space
E N D
Presentation Transcript
Measuring Biodiversity Biology/Env S 204 Spring 2009
Measuring Biodiversity • Genetic Diversity • Species Diversity • Taxonomic Diversity • Surveys • Patterns in Time • Patterns in Space • Dimensionless Patterns
Measuring Biodiversity: Genetic Diversity • Extremely important, but very time- and resource-intensive to measure accurately • Focus tends to be on individual species • Can’t do this for fossils • Of greatest utility in conservation and management of rare species • Preservation of habitat for rare species often beneficial for other species
Measuring Biodiversity:Species Diversity • Two main aspects: species richness and species abundance • Species richness = the number of species in an area; often the only information available, depends on baseline taxonomic data • Species abundance = relative commonness of species, or evenness; requires baseline ecological data
Measuring Biodiversity:Taxonomic Diversity • Taxonomic diversity= richness of higher taxonomic categories (number of major lineages is a rough measure) • Distinctness of evolving lineages is an important component of biodiversity (Species X is an example) • Some assign a higher conservation value to ancient or very distinct lineages
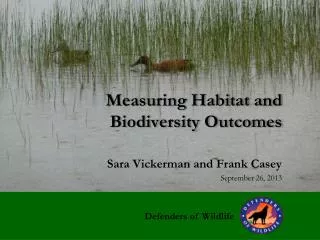
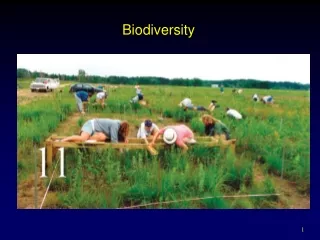
Measuring Biodiversity:Surveys • Ideally should combine both taxonomy and ecology • Depends on floras (ID guides and descriptions for all plants in an area), faunas (= floras, but for animals), checklists, data from permanent plots, good natural history observations, satellite images, GIS data
Measuring Biodiversity:Surveys • ATBI = All Taxa Biodiversity Inventory • Some relatively large areas representing different habitats would be completely inventoried for all groups • Analyses would reveal patterns of diversity, abundance, interactions, etc. and a baseline for assessment of biodiversity in other similar areas
Measuring Biodiversity:Patterns in Time • Increase in total diversity over evolutionary time 2) Succession 3) Seasonal variation
Measuring Biodiversity:1) Increase in total diversity • Life first evolved on Earth about 3.8 bya • Eukaryotes appeared by 1.5-1.25 bya • Bursts of diversification associated with new adaptations or opportunities • Overall pattern is one of increasing diversity in evolutionary time, despite background extinctions and five mass extinction events
Measuring Biodiversity:2) Succession • Change after a disturbance; often species replace each other in a more or less orderly sequence • Succession occurs in all natural communities • Immigration and competitive displacement are fundamental processes in succession • Creates both spatial and temporal patterns following disturbances
Measuring Biodiversity:3) seasonal variation • Annual cycles of diversity • Migration, dormancy/hibernation, and endangered phenomena are included here
Measuring Biodiversity:3) annual migrations • Many birds, some insects migrate on an annual basis • One study showed that up to 60% of the bird species in an Ohio forest were migratory • In the tropics, birds will migrate seasonally up and down the mountains
Measuring Biodiversity:3) dormancy/hibernation • Many members of the biota disappear physiologically during the winter or drought periods • In desert regions, annual plants exist as seeds until sufficient rain falls and then they complete their life cycles in weeks • Lots of diversity is hidden this way
Measuring Biodiversity:3) endangered phenomena • Endangered phenomena = a spectacular aspect of the life history of an animal or plant species involving large numbers of individuals that is threatened with impoverishment or decline • The species itself may not be endangered but the phenomenon is
Measuring Biodiversity:3) endangered phenomena • Examples include: ecological diversity associated with flooding rivers; the 17-year and 13-year cicada emergence events in North America; animal migrations; the existence of species in huge herds
Measuring Biodiversity:Patterns in Space • Species-Area Curve • Habitat Diversity • Latitudinal gradients • Areas of endemism • Disturbance
Measuring Biodiversity:1) Species-Area Curve • You will find more species if you sample a larger area • Basic relationship remains even at different scales • Curves may differ depending on islands vs. continents, areas with different histories • One of the earliest-recognized relationships
Measuring Biodiversity:2) habitat diversity • The greater the habitat variety in an area, the greater the species diversity • Also, the more complex the community, the greater the species diversity • Related to the Species-Area Curve and regional diversity
Measuring Biodiversity:3) latitudinal gradients • The inventory of species declines as you move away from the Equator, north or south • More species in the tropics than in higher-latitude communities • True for most groups; exceptions include brown algae, coniferous trees, salamanders, penguins, waterfowl • Are analogous altitudinal and depth gradients
Measuring Biodiversity:4) areas of endemism • Endemic = found only in one geographic area or habitat • Areas with a high proportion of unique species not found elsewhere are “hotspots” (areas of endemism) • Non-randomly distributed on Earth • Islands often have a high proportion of endemic species (due to isolation)
Measuring Biodiversity:4) areas of endemism • Endemism in temperate regions is concentrated in areas of Mediterranean climate (California, South Africa, Chile) • Patterns of endemism can vary greatly but are correlated among mammals, birds and reptiles • Plants tend to speciate in smaller areas than vertebrates, however
Measuring Biodiversity:5) disturbance • Diversity peaks over intermediate disturbance levels • Patches with very high or very low rates of disturbance will have lower diversity • Many types of disturbance and different scales • This pattern relies on small-scale disturbance (not mass extinctions)
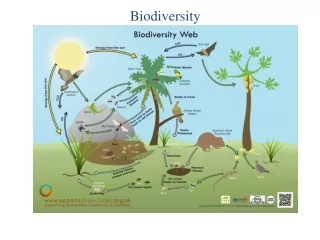
Measuring Biodiversity:Dimensionless patterns • These are patterns not rooted in space or time per se • Examples include: reproductive rate, longevity, body mass/metabolism ratios • Food Webs and Chains: animal diversity declines as trophic level increases, usually 3-4 trophic levels present, but 5 or 6 are rare • Real webs tend to have relatively few omnivores