Download
1 / 30
300 likes | 717 Vues
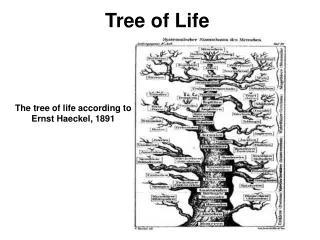
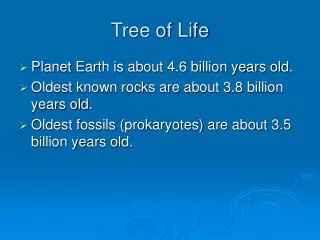
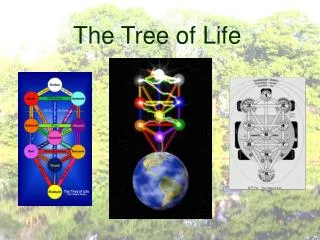
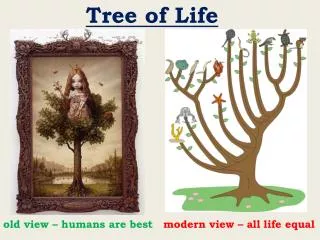
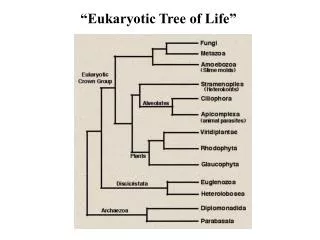
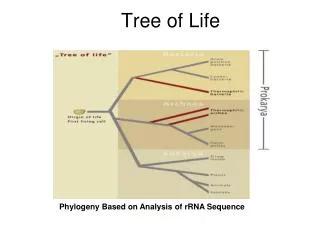
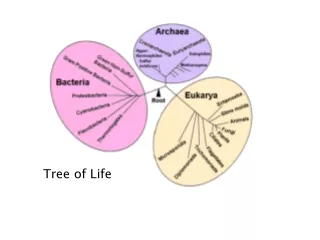
Tree of Life. Figure 4.24. Fungi. Eukaryotic Mostly multicellular Some unicellular (molds, yeasts) Heterotrophs > 500 marine species Important decomposers Parasites (seagrasses, mollusc shells) Source of antibiotics (like the Penicillium fungi) (remember bioprospecting?)

E N D
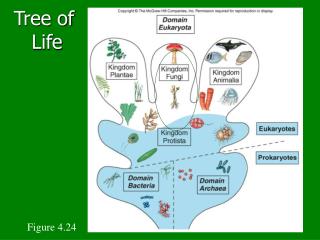
Tree of Life Figure 4.24
Fungi • Eukaryotic • Mostly multicellular • Some unicellular (molds, yeasts) • Heterotrophs • > 500 marine species • Important decomposers • Parasites (seagrasses, mollusc shells) • Source of antibiotics (like the Penicillium fungi) (remember bioprospecting?) • Symbionts – lichens, filament-like growths on algae provide structural support, while algae provides food
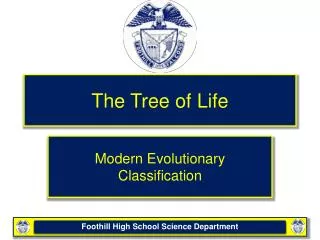
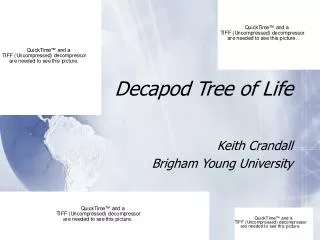
Tree of Life -All have leaves, stems, roots, -Specialized tissues to transport water, nutrients, food from photosynthesis Figure 4.24
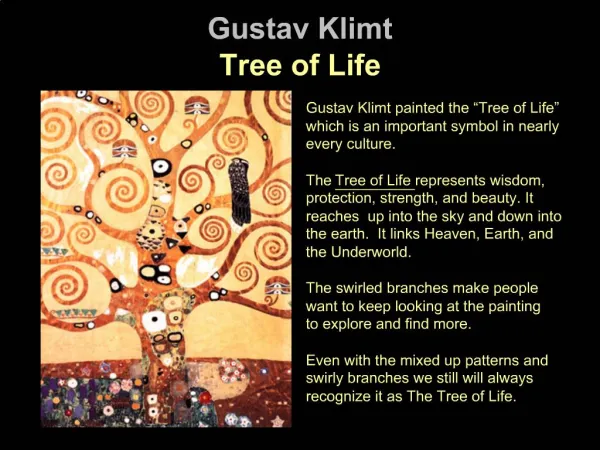
Flowering Plants (Angiosperms)- produce fruit with seeds • Seagrasses (50 – 60 species) • Not true grasses (related to lilies) • Roots, stems and shoots grow from horizontal rhizome • Flowers typically small and inconspicuous Eelgrass (Zostera) – Temperate Atl, Pac; Tropical Pac Turtle grass (Thalassia) – Tropical Temperate Pac
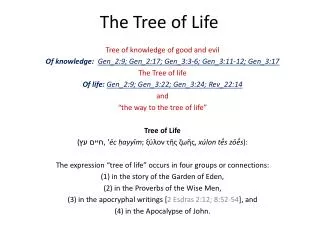
Flowering Plants (Angiosperms) – • Salt Marshes • Cord grass (Spartina) • Pickleweed (Salicornia) Spartina Salicornia
Flowering Plants (Angiosperms) • Mangroves Avicennia: grey or black mangrove Variety of trees and shrubs Tropical/subtropical Salt tolerant-osmosis issue Thick leaves Viviparous-form propagules Rhizophora: red mangrove
Flowering Plants (Angiosperms) • Mangroves vs Salt Marshes
What is photosynthesis? What are autotrophs? Solar energy 6CO2 + 6H2O → C6H12O6 + 6O2 Fig. 4.5 Photosynthesis new organic compounds • Solar energy powers the reaction • Carbon dioxide and water used to make glucose • Oxygen gas is released as a by-product inorganic materials
Photosynthesis Fig. 4.8b What absorbs light energy? - Chloroplast contains the photosynthetic pigment chlorophyll -Absorbs mainly red and violet- blue regions of visible light Chl a absorbance Fig. 4.6
Fig. 4.5 Cellular Respiration 6CO2 + 6H2O ← C6H12O6 + 6O2 Chemical energy • opposite of photosynthesis • Releases energy in glucose, organisms store in ATP molecules until use • - Both autotrophs and heterotrophs respire
Primary Production (P°) • What is primary production? • Net gain in organic matter that results when autotrophs photosynthesize more than they respire, i.e., P >>> R • ****Requires nutrients for organisms to grow, reproduce**** • This organic matter (new plant material) is available for heterotrophs
Primary Production • ‘primary’ production because photosynthesis is the basis of most marine biomass production • Primary productivity is the rate of primary production, the rate at which plant material is produced
Pmax photoinhibition Pn Photosynthesis (P) Pg + 0 - Compensation point respiration Ic Light intensity (I) Photosynthesis as a function of Light Intensity (P vs. I) Pg – Gross Primary Productivity Pn – Net Primary Productivity Pmax – maximal photosynthesis value Ic – compensation light intensity
Pmax photoinhibition Pn Photosynthesis (P) Pg + 0 - Compensation point Respiration R Ic Light intensity (I) Gross photosynthesis: Total photosynthesis before subtracting respiration Net photosynthesis: Gross photosynthesis minus respiration, i.e. Pg – R Is available to support other trophic levels Compensation point: Light intensity when photosynthesis equals respiration, i.e. P = R Lower part of the photic zone
Ecological Zonation of the Marine Environment Photic Zone Fig. 10.20
Photic Zone • Part of the pelagic that light penetrates (0 to 100-200m) • Clarity of water: • Seasons • Location • Phytoplankton carry out photosynthesis • Primary Production (Pº) is at maximum • Responsible for up to 95% of all marine primary production • start of the marine food chain
Marine Organisms Grouped by Lifestyle Fig. 10.19
2 easy ways to measure primary production • Either measure Oxygen (endpoint of the photosynthesis reaction) • Or measure Chlorophyll a (approximates phytoplankton biomass
Today’s Lab:measuring photosynthesis = Pn = R = Pg Fig. 10.15
Photosynthesis – Primary Production Experiment Purpose: To determine if more light produces more Net photosynthesis (Pn). Hypothesis: Net photosynthesis (Pn) in high light conditions will be greater than Net photosynthesis (Pn) in a low light environment.
Methods • Six groups of 2 people (some groups will have 3) • Each group gets 2 BOD (Biological Oxygen Demand) bottles. 1 will be the LIGHT bottle and the other the DARK bottle. • Three groups will keep bottles under the high light and three will put bottles in low light. • Measure and record t=26 hrs oxygen concentration in mg/L. Do NOT remove foil until you take the measurement. Use the same DO meter. (t=0 was already done) • Each group measure light levels in two environments
Results • Adjust initial and final oxygen concentrations • Light levels • Record light levels in high light and low light conditions for comparison • Errors? • Record any animals. • Record bubbles in light bottle.
Results • Adjust initial and final oxygen concentrations • Light levels • Record light levels in high light and low light conditions for comparison • Errors? • Record any animals. • Record bubbles in light bottle.
Results-photosynthesis experiment Calculations Gross photosynthesis Pg = (Final O2-Initial O2) in Light Bottle – (Final O2-Initial O2) in dark bottle Incubation period Incubation period Net photosynthesis Pn= (Final O2-Initial O2) in light bottle = Pg – R Incubation period Respiration R = (Initial O2-Final O2) in dark bottle Incubation period Units Oxygen concentration: mg L-1 Incubation time: hr Pg, Pn, R: mg oxygen L-1 hr-1
Nutrient experiment • Purpose: To evaluate if nutrient (nitrate) concentration has an effect on phytoplankton • Hypothesis: Increased nitrogen concentration yields increased chlorophyll a production, and therefore, phytoplankton biomass • What was done ahead of time: • Dr. Gorga took a phytoplankton culture, controlled for light and nutrients, and added NO3 in 3 different concentrations (0, 200, and 450 mM ) • We will measure chlorophyll a (fluorescence as a proxy)
Methods • Take bottle with phytoplankton, • Filter using vacuum-filtration apparatus • Place filter in tube, add methanol, agitate and crush filter with metal spatula • Put in freezer (-20oC) for 5 minutes • Centrifuge vial at top speed (5 minutes) • Transfer supernatant to cuvette (~ 2 ml) • Put cuvette in fluorometer, read fluorescence • Convert to chlorophyll a (fluorometer does this)
Lab Report • Write up two experiments: • How light and nutrients affect phytoplankton production (of oxygen, of cells/biomass) • Bring two copies to class-due in class, October 9th, 10th • Part of grade will be review of colleague’s report (worth 5 points of 25 total report grade) • Reports: double spaced, 4-5 pages, include tables and figures as needed • Figures, plot light versus average Pn (remember legend), plot nutrient concentration versus chlorophyll a • Remember the big picture/broader impact for discussion/introduction: • how light and nutrients affect phytoplankton production in the ocean, • what about nutrient limitation, light limitation • changes in both over time, with nutrients in proximity to coastal zone (humans) • Cloudy versus sunny days