Download
1 / 35

E N D
Brief History • Nuclear energy was first discovered in 1934 by Enrico Fermi. The first nuclear bombs were built in 1945 as a result of the infamous Manhattan Project. The first plutonium bomb, code-named Trinity, was detonated on July 16, 1945 in New Mexico. On August 6th 1945 the first uranium bomb was detonated over Hiroshima. Three days later a plutonium bomb was dropped on Nagasaki. There is over 200,000 deaths associated with these detonations. Electricity wasn’t produced with nuclear energy until 1951. Source: The Green Peace Book of the Nuclear Age by John May
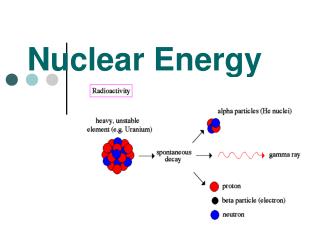
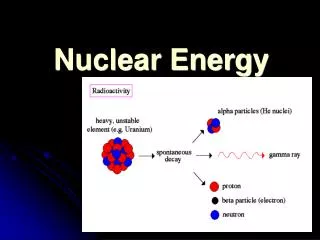
Radiation • Radiation is the result of an unstable atom decaying to reach a stable state. Half-life is the average amount of time it takes for a sample of a particular element to decay half way. Natural radiation is everywhere—our bodies, rocks, water, sunshine. However, manmade radiation is much stronger. There are currently 37 radioactive elements in the periodic table—26 of them are manmade and include plutonium and americium (used in household smoke detectors). Source: http://theodoregray.com/PeriodicTable/index.html
History of nuclear power 1938– Scientists study Uranium nucleus 1941 – Manhattan Project begins 1942 – Controlled nuclear chain reaction 1945 – U.S. uses two atomic bombs on Japan 1949 – Soviets develop atomic bomb 1952 – U.S. tests hydrogen bomb 1955 – First U.S. nuclear submarine
U.S. ELECTRICITY PRODUCTION COSTS 1995-2007, In 2007 cents per kilowatt-hour ¢/kw-hr Production Costs = Operations and Maintenance Costs+ Fuel Costs Source: Global Energy Decisions Updated: 5/08
TOP 10 NUCLEAR GENERATING COUNTRIES2007, Billion kWh Source: International Atomic Energy Agency, U.S. is from Energy Information Administration Updated: 5/08
ONE TRUCK (2 TONNES URANIUM) = 25 TRAINLOADS (260,000 TONNES COAL)
Carbon Dioxide Prevented by Nuclear Energy in the Electric Sector(in million metric tons)Source: U.S. Energy Information Administration, 2007
Uranium • Uranium is usually mined similarly to other heavy metals—under ground or in open pits—but other methods can also be used. After the uranium is mined it is milled near the excavation site using leaching processes.
Mining • Uranium ore is usually located aerially; core samples are then drilled and analyzed by geologists. The uranium ore is extracted by means of drilling and blasting. Mines can be in either open pits or underground. Uranium concentrations are a small percentage of the rock that is mined, so tons of tailings waste are generated by the mining process. Sources: http://www.anawa.org.au/mining/index.html and http://www.energyres.com.au/ranger/mill_diagram.pdf and http://www.world-nuclear.org/education/mining.htm
Milling & Leaching • The ore is first crushed into smaller bits, then it is sent through a ball mill where it is crushed into a fine powder. The fine ore is mixed with water, thickened, and then put into leaching tanks where 90% of the uranium ore is leached out with sulfuric acid. Next the uranium ore is separated from the depleted ore in a multistage washing system. The depleted ore is then neutralized with lime and put into a tailings repository. Sources: http://www.anawa.org.au/mining/index.html and http://www.energyres.com.au/ranger/mill_diagram.pdf
Yellowcake • Meanwhile, the uranium solution is filtered, and then goes through a solvent extraction process that includes kerosene and ammonia to purify the uranium solution. After purification the uranium is put into precipitation tanks—the result is a product commonly called yellowcake. Sources: http://www.anawa.org.au/mining/index.html and http://www.energyres.com.au/ranger/mill_diagram.pdf
Transportation • In the final processes the yellow cake is heated to 800˚Celcius which makes a dark green powder which is 98% U3O8. The dark green powder is put into 200 liter drums and loaded into shipping containers and are shipped overseas to fuel nuclear power plants. Sources: http://www.anawa.org.au/mining/index.html and http://www.energyres.com.au/ranger/mill_diagram.pdf
Mining Leaders • Australia and Canada are currently the biggest Uranium miners. The aforementioned process that takes place in Australia is exported because Australia does not have a nuclear energy program. The mining in Australian is primarily open pit, while the mining in Canada is mostly underground. Following is two charts—one is the major uranium producing countries, the other is of the major corporations that actually do the mining. Source: http://www.antenna.nl/wise/uranium/uwai.html
Production in 2000 Source: http://www.world-nuclear.org/search/index.htm
Other Mining Methods • Another method of uranium mining is in-situ leaching. This method is used because there is reduced hazards to the employees of the mines, it is less expensive, and there are no large tailings deposits. However, there are also several significant disadvantages including ground water contamination, unknown risks involving the leaching liquid reacting to the other minerals in the deposit, and an inability to restore the leaching site back to natural conditions after the leaching process is done. Source: http://www.antenna.nl/wise/uranium/uisl.html
In-Situ Leaching Source: http://www.antenna.nl/wise/uranium/uisl.html
Overview • Uranium ore sometimes contains as little as 500 grams recoverable uranium per 1000 kilograms of earth. So, enormous amounts of rock have to be dug up, crushed and chemically processed to extract the uranium. The remaining wastes, which still contain large amounts of radioactivity, remain at the mines. These "tailings" are often stored in a very poor condition, resulting in the contamination of surface- and groundwater.” Source: http://www.antenna.nl/wise/
Transportation • Radioactive materials are transported from the milling location to the conversion location, then from the conversion location to the enrichment location, then from the enrichment location to the to the fuel fabrication facility, and finally to the power plant. These materials are transported in special containers by specialized transport companies. People involved in the transport process are trained to respond to emergencies. In the US, Asia, and Western Europe transport is mainly by truck, and in Russia mainly by train. Intercontinental transport is usually by ship, and sometimes by air. Since 1971 there has been over 20,000 shipments with no incidents and limited operator exposure. Source: http://www.world-nuclear.org/info/inf20print.htm Picture: http://www.ocrwm.doe.gov/wat/facts.shtml
WASTE DISPOSAL A concern to many people Used (spent) nuclear fuel consists of ceramic pellets encased in metal tubes Current solution: On-site storage at NPPs
WASTE DISPOSAL A concern to many people Used (spent) nuclear fuel consists of ceramic pellets encased in metal tubes…and still contains much useful energy Current solution: On-site storage at nuclear power plant sites
TRANSPORTATION • Over the last 40 years, 3,000 shipments of spent nuclear fuel on 1.7 million miles of U.S. roads performed safely • Each shipment carefully packaged and monitored • Casks are ~15 times thicker than a gasoline tank truck shell and include 3 inches of stainless steel with thick lead radiation shields • Typically for every ton of spent fuel there are 3 tons of protective packaging