Download
1 / 58
580 likes | 673 Vues
This talk covers Earth's physics, energy balance models, greenhouse effects, human impact on carbon emissions, energy fluxes, and the importance of Second-Law Efficiency for sustainable practices. It also delves into fossil fuel resources, depletion concerns, and the future of renewable energy. The session is enriched with detailed data, statistics, and thought-provoking insights relevant to physicists and educators.

E N D
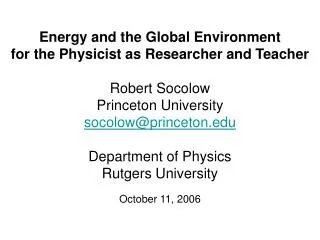
Energy and the Global Environment for the Physicist as Researcher and TeacherRobert SocolowPrinceton Universitysocolow@princeton.eduDepartment of Physics Rutgers UniversityOctober 11, 2006
Good Advice Long Ago Received Never underestimate a person’s intelligence, nor overestimate what they know.
Outline of Talk • The Earth system • The energy system • Anthropogenic carbon
Earth’s Energy Balance Model 1: /4 = T4. = 1368 W/m2 T= 279K Model 2: (1-a) /4 = T4. a = 0.31 T= 254K. (Adding an albedo is better science but gives a worse result.) Actual Te = 288K.Missing: An atmosphere with a greenhouse effect (responsible for 34K of warming). Rubin, p. 476
Visible Range H2O CO2 CH4 O2, O3 N2O Total ~400 nm ~700 nm Spectrum of the Sun’s Incoming Radiation Rubin, p. 482
Spectrum of the Earth’s Outgoing Radiation Rubin, p. 482
Antarctic Ice Core Source: Gabrielle Walker, “Frozen time,” Nature; Jun 10, 2004; 429, 6992; Research Library Core, pg. 596
CO2,CH4 and estimated global temperature (Antarctic ΔT/2 in ice core era) 0 = 1880-1899 mean. Source: Hansen, Clim. Change, 68, 269, 2005. Temperature, CO2, and methane track each other
Mauna Loa CO2 data, 1958-2004 Source: Oak Ridge National Laboratory, Carbon Dioxide Information Analysis Center http://cdiac.ornl.gov/trends/co2/graphics/mlo145e_thrudc04.pdf
Today’s atmosphere as a bathtub 780 billion tons of carbon (GtC), as CO2 380 CO2 molecules out of every million air molecules of all kinds 2 GtC/yr added to biosphere, in spite of deforestation 2 GtC/yr absorbed by oceans 8 GtC/yr removed from below ground and burned
Atmospheric CO2 Concentration with and without 1980-99 sinks “Sinks” Good enough model: Half stays in. Fact about our Atmosphere: 2.1 GtC = 1 ppm
Ratio: Solar Input/ Human Use • Solar Input: 120x1015 W • [0.69 x 1368 W/m2] x [ x (6370 km)2] • Human Use: 13x1012 W (2 kW/capita) • 400 EJ/year • Ratio = 10,000. How could we possibly get into trouble? Answer: via carbon dioxide.
Energy fluxes from human activity # Assumes NJ and US per capita primary energy consumption are the same.
ENERGY UNITS Industry also uses volume units: gallons, liters, barrels, cubic feet, cubic meters. E.g., the scfd, pronounced “scuff,” a standard cubic foot of natural gas per day.
Spaghetti diagram for U.S., 2002 71% of electricity goes to buildings (60% in 1976) Buildings elec is fastest growing element, 1976-2002: Multiple is 2.1 67% of oil used in U.S. goes to vehicles (54% in 1976) A power plant is a building! Unit here is the Quad: 1 Quad = 1015 Btu.
U.S. 1976 U.S. 2002 All data are for 2002 except U.S. 1976 point. Areas of points: proportional to populations. A larger fraction of electricity goes to buildings in rich countries All data are for 2002 except U.S. 1976 point “Buildings Electricity” = 100% Commercial and Residential + 15% Industrial + 10% Agricultural. Data provided by Paul Waide, graphics by Shoibal Chakravarty
Second-Law Efficiency Second-Law Efficiency (American Physical Society, 1974) is well known to the chemical engineers as “exergy.” The key concept is the “infinite,” ≈300K heat reservoir at the Earth, from which heat can be withdrawn and to which it can be sent. Heat exchange at temperatures close to 300K can be achieved with very little work. The water heater that converts 90% of its electricity to 50oC hot water is not an impressive device. It is productive to distinguish energy uses as work and as heat, and also the temperature of the heat required. This leads to emphasis on the co-location of work and heat demands (e.g., cogeneration of heat and power) and high and low temperature heat demands (heat cascades, as in steam integration).
Conventional oil: a negligible fraction of fossil fuel Hubbert (logistic) curve for all fossil fuel: 5600 GtC total, fit to IS92a GtC/yr IS92a scenario ALL FOSSIL FUEL Today Hubbert oil curve: 3 GtC/yr peak today, 230 GtC (2000x109bbl) total x x x x x x OIL x x x x Source for “all fossil fuel”: Bryan Mignone
Global Fossil Carbon Resources 2.1 GtC = 1 ppm. Today’s consumption rate: 7 GtC/yr. OIL DEPLETION WON’T SAVE US FROM THE GREENHOUSE EFFECT. Source Rogner, Ann. Rev. Energy and Env. 22, p. 249. Also used: 1 toe = 41.9 GJ; 20.3 kg(C)/GJ(oil); 13.5 kg(C)/GJ (gas); 24.1 kg(C)/GJ(coal).
Will the fossil fuel system wither away? YES NO Will the case for Greenhouse damage wither away? YES A nuclear or renewables world unmotivated by climate. Most people in the fuel industries and most of the public arehere NO Environmentalists, nuclear advocates are often here. OUR WORKING ASSUMPTIONS What if the fossil fuel future is robust, but the Greenhouse problem is severe?
Past Emissions Billion of Tons of Carbon Emitted per Year 14 Historical emissions 7 1.9 0 2105 1955 2005 2055
The Stabilization Triangle Billion of Tons of Carbon Emitted per Year Easier CO2 target 14 ~850 ppm Currently projected path Stabilization Triangle Interim Goal O Historical emissions 7 Flatpath Tougher CO2 target ~500 ppm 1.9 0 2105 1955 2005 2055
21 Business As Usual GtC/yr (530) (750) 14 Ramp = Delay Stabilization triangle 850 ppm Historical emissions (470) 7 Flat = Act Now 500 ppm (850) (320) (500) (500) 1.9 (500) 2205 2155 1955 2005 2055 2105 The Stabilization Triangle: Beat doubling or accept tripling (details) (380) (850) Values in parentheses are ppm. Note the identity (a fact about the size of the Earth’s atmosphere): 1 ppm = 2.1 GtC.
The Interim Goal is Within Reach • Reasons for optimism that global emissions in 2055 need not exceed today’s emissions: • The world today has a terribly inefficient energy system. • Carbon emissions have just begun to be priced. • Most of the 2055 physical plant is not yet built
Stabilization triangle in CCTP 2056 “Potential Scale of CO2 Emissions Reductions to Stabilize GHG Concentrations: Hypothetical Unconstrained and Constrained Emissions Scenarios,” Fig 3-11, p. 37, Climate Change Technology Program Strategic Plan, US DOE, September 2006
Wedges Billion of Tons of Carbon Emitted per Year 14 14 GtC/y Currently projected path Seven “wedges” O Historical emissions 7 GtC/y 7 Flatpath 1.9 0 2105 1955 2005 2055
1 GtC/yr Total = 25 Gigatons carbon 50 years • Cumulatively, a wedge redirects the flow of 25 GtC in its first 50 years. This is 2.5 trillion dollars at $100/tC. A “solution” to the CO2 problem should provide at least one wedge. What is a “Wedge”? A “wedge” is a strategy to reduce carbon emissions that grows in 50 years from zero to 1.0 GtC/yr. The strategy has already been commercialized at scale somewhere.
Heating, other Transportation Electricity Electricity: 40%; fuels used directly: 60%. CO2 Emissions by Sector and Fuel Allocation of 6.2 GtC/yr 2000 global CO2 emissions
15 Ways to Make a Wedge Source; Socolow and Pacala, Scientific American, September 2006, p.54
The Virtual Triangle: Large Carbon Savings Are Already in the Baseline 28 Emissions proportional to economic growth 21 GtC/yr Virtual Triangle 14 Currently projected path Stabilization Triangle Historical emissions 7 Flat path 1.9 0 1955 2005 2055 Models differ widely in their estimates of contributions to the virtual triangle from structural shifts (toward services), energy efficiency, and carbon-free energy.
Priority #1: Efficient end-use The post-industrialized age features unprecedented private consumption. Life, liberty, and the pursuit of comfort and mobility. The result of this pursuit is that more than 60% of oil is for transport, and more than 60% of electricity is for buildings.
Efficient Use of Fuel Effort needed by 2055 for 1 wedge: 2 billion cars driven 10,000 miles/yr at 60 mpg instead of 30 mpg. 1 billion cars driven, at 30 mpg, 5,000 instead of 10,000 miles/yr. CCTP Strategic Plan (U.S.), Sept. 2006: 1 billion cars driven 10,000 miles/yr at 40 mpg instead of 20 mpg A car at 30 mpg, 10,000 miles/yr, emits 1 tC/yr.
Priority #2: New long-lived stock Today, huge world-wide investment in long-lived capital stock (new infrastructure, new buildings, and new power plants. Making all new capital “carbon smart” is essential, because fixing up later is costly. Energy efficiency and carbon efficiency should be incorporated into all new long-lived capital – in developing and in industrialized countries.
Historic emissions, all uses 2003-2030 power-plant lifetime CO2 commitments WEO-2004 Reference Scenario. Lifetime in years: coal 60, gas 40, oil 20. Emission Commitments from Capital Investments Deter investments in new long-lived high-carbon stock: (e.g., power plants, buildings). Coordinate “green-field” (new) and “brown-field” (replacement). Needed: “Commitment accounting.” Credit for comparison: David Hawkins, NRDC
Wind Electricity • Effort needed by 2055 for 1 wedge: • One million 2-MW windmills displacing coal power. • Today: 50,000 MW (1/40) Prototype of 80 m tall Nordex 2,5 MW wind turbine located in Grevenbroich, Germany (Danish Wind Industry Association)
Effort needed by 2055 for 1 wedge: 700 GW (twice current capacity) displacing coal power. Nuclear Electricity Phase out of nuclear power creates the need for another half wedge. Graphic courtesy of NRC
Power with Carbon Capture and Storage Effort needed by 2055 for 1 wedge: Carbon capture and storage at 800 GW coal power plants. Graphics courtesy of DOE Office of Fossil Energy
Steam plant by river Coal feeder ramp Gas turbine powered by CO + H2 Oxygen plant Gasifier IGCC plants are nearly coal CCS plants • BP will use petcoke and add, at its Carson refinery, California, USA: • CO2 capture [CO + H2O CO2 + H2, CO2 - H2 separation, CO2 absorption ]; • H2 to turbine for power; 3) CO2 pressurization and export off site for EOR. Graphics courtesy of DOE Office of Fossil Energy
Hydrogen Power from Refinery Residues in California • BP will: • gasify 4500 t/day of petcoke, producing H2 and CO2, at its 260,000 bbl/day Carson refinery • burn 800 tons/day of H2 in turbines for 510 MW of power • export off-site 4 MtCO2/yr for enhanced oil recovery. Los Angeles Carson refinery (BP)
Natural CO2 fields in southwest U.S. • McElmo Dome, Colorado: 0.4Gt(C) in place • 800 km pipeline from McElmo Dome to Permian Basin, west Texas, built in the 1980s • Two conclusions: • CO2 in the right place is valuable. • CO2 from McElmo was a better bet than CO2 from any nearby site of fossil fuel burning.
Already, in the middle of the Sahara! At In Salah, Algeria, natural gas purification by CO2 removal plus CO2 pressurization for nearby injection Separation at amine contactor towers
The Future Fossil Fuel Power Plant • Shown here: After 10 years of operation of a 1000 MW coal plant, 60 Mt (90 Mm3) of CO2 have been injected, filling a horizontal area of 40 km2 in each of two formations. • Assumptions: • 10% porosity • 1/3 of pore space accessed • 60 m total vertical height for the two formations. • Note: Plant is still young.
Coal-based Synfuels with CCS* *Carbon capture and storage • Effort needed for 1 wedge by 2055 • Capture and storage of the CO2 byproduct at plants producing 30 million barrels per day (mbd) of coal-based synfuels. (Global oil: 80 mbd; South Africa synfuels, 0.16 mbd.) • Assumption: half of C originally in the coal is available for capture, half goes into synfuels. • 120 Mt/yr coal yields 1 mbd synfuels. • Consumption (Mt/yr, 2002): World, 4800; China, 1300; U.S and Canada ,1100. Liquid-phase synthesis of methanol from CO + H2. Graphics courtesy of DOE Office of Fossil Energy Result: Coal-based synfuels have no worse CO2 emissions than petroleum fuels, instead of doubled emissions.
Carbon Storage Effort needed by 2055 for 1 wedge: 3500 Sleipners @1 MtCO2/yr 100 x U.S. CO2 injection rate for EOR A flow of CO2 into the Earth equal to the flow of oil out of the Earth today Sleipner project, offshore Norway Graphic courtesy of David Hawkins Graphic courtesy of Statoil ASA
Do wedge strategies get used up? • For any strategy, is the second wedge easier or harder to achieve than the first? Are the first 12 million hectares of biofuels more expensive or cheaper than the second 12 million hectares of biofuels ? • The first 12 million hectares will be the more favorable sites. • But the second 12 million will benefit from the learning (institutional as well as technological) acquired from planting, harvesting, and sellng the first million. • The question generalizes to almost all the wedge strategies: Engine efficiency, enhanced oil recovery, wind for hydrogen. • All present the same question: Will saturation or learning dominate?