Download
1 / 20
330 likes | 1.01k Vues
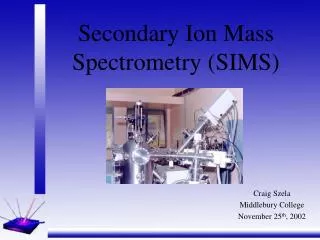
Secondary Ion Mass Spectrometry (SIMS). Craig Szela Middlebury College November 25 th , 2002. Contents. Uses Overview Components Techniques Drawbacks Figures of Merit Variations Resources. Uses.

E N D
Secondary Ion Mass Spectrometry (SIMS) Craig Szela Middlebury College November 25th, 2002
Contents • Uses • Overview • Components • Techniques • Drawbacks • Figures of Merit • Variations • Resources
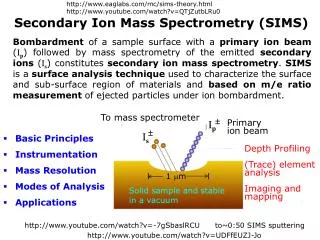
Uses • NASA first developed SIMS in the 1960s to investigate the composition of Moon rocks. The method proved so successful, that the apparatus was commercially produced. • SIMS can be used to determine the composition of organic and inorganic solids at the outer 5 nm of a sample. • To determine the composition of the sample at varying spatial and depth resolutions depending on the method used. This can generate spatial or depth profiles of elemental or molecular concentrations. • These profiles can be used to generate element specific images of the sample that display the varying concentrations over the area of the sample. • To detect impurities or trace elements, especially in semi-conductors and thin filaments.
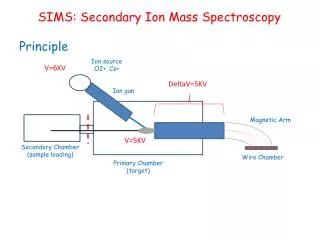
Basic Overview University of Arizona SIMS, http://www.u.arizona.edu/~xiuminj/web/SIMSdefault.htm
Secondary ion generation • The sample is prepared in an ultra high vacuum. • A beam of primary ions or neutral particles impacts the surface with energies of 3-20 keV. • A primary ion or particle causes a collision cascade amongst surface atoms and between .1 and 10 atoms are usually ejected. This process is termed sputtering. The sputter yield depends on the nature of the analyte.
Collision Cascade • Of these ejected atoms some are ionized (usually less than 10%), these are the secondary ions. The matrix of a sample must be known to accurately determine elemental concentrations, as ionization yields can vary as much as three orders of magnitude between nearly identical atomic sputtering yields. • Secondary ions can then be analyzed using mass spectroscopy. http://www.siu.edu/~cafs/surface/file6.html
Primary Particle Bombardment • Primary particles are accelerated through an electrical field. Kinetic energy and thus particle velocity are generated through the relationship of Ek= qV = ½ mv2. • The particles used are either reactive (often: O-, O2+, or Cs+) or inert (usually: Ar+, Ar, Xe+, Xe, He+, or Ne+) • Ion fluxis the term used to quantify the number of primary ions which bombard an anlalyte per unit time and area. The beam current usually affects the analyte on magnitudes ranging from nA to mA per cm2. • Ablation is the term used to describe the process of primary ions eating away at the sample by ejecting secondary ions.
Implications of Ionization Efficiencies • The atoms tend to be ionized at varying levels. • The sample matrix must be known, because it effects the propensity of an atom to be ejected in its ionic form. For instance the Cu+ fraction of sputtered Cu from metallic copper and copper oxide differs by a factor of 24. • Ionization rates are compared to Cs, which is ionized very easily, its ionization efficiency is 1. • The correction is necessary, otherwise the composition of a sample will be underestimated for all atoms but Cs.
Matrix Standard • A solid matrix standard must be used to match the analyte’s matrix. • Matrix specific Relative Sensitivity Factors (RSFs) are used to correct for sputtering yields and ionization efficiencies. -http://www.cea.com/cai/simstheo/rsf.htm
The 3 SIMS Analysis Modes • Static SIMS are used to determine surface concentrations of elements and molecules without significantly altering the analyte. • Imaging SIMS like static SIMS does not alter the analyte appreciably. This mode is used to generate images or maps of analytes based upon concentrations of one secondary ion representing either an element or molecule. • Dynamic SIMS involves the use of a much higher energy primary beam (larger amp beam current). It is used to generate sample depth profiles.
Static SIMS • Low ion flux is used. This means a small amount of primary ions is used to bombard the sample per area per unit time. Sputters away approximately only a tenth of an atomic monolayer. • Ar+, Xe+, Ar, and Xe are the commonly used particles present in the primary particle beam, which has a diameter of 2-3 mm. • The analysis typically requires more than 15 minutes. • This technique generates mass spectra data well suited for the detection of organic molecules.
Static SIMS: Organic Analytes • Fragmentation and subsequent ion formation of the sample can reveal the overall structure of the molecule through mass spectrometry. Polymethylmethacrylate SIMS (a) positve and (b) negative SIMS data. -http://www.siu.edu/~cafs/surface/file6.html
Imaging SIMS • The mass spectrometer is set to only detect one mass. • The particle beam traces a raster pattern over the sample with a low ion flux beam, much like Static SIMS. • Typical beam particles consists of Ga+ or In+ and the beam diameter is approximately 100 nm. • The analysis takes usually less than 15 min. • The intensity of the signal detected for the particular mass is plotted against the location that generated this signal. • Absolute quantity is difficult to measure, but for a relatively homogeneous sample, the relative concentration differences are measurable and evident on an image. • Images or maps of both elements and organics can be generated.
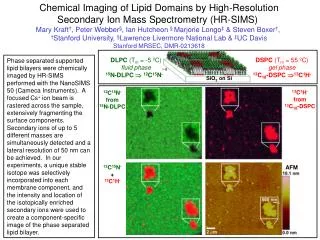
Images created using the Imaging SIMS mode. Scanning ion image of granite from the Isle of Skye. -University of Arizona SIMS 75 x 100 micrometers.
Dynamic SIMS • The higher ion flux used in dynamic SIMS eats away at the surface of the analyte, burying the beam steadily deeper into the sample and generating secondary ions that characterize the composition at varying depths. • The beam typically consists of O2+ or Cs+ ions and has a diameter of less than 10 μm. • The experiment time is typically less than a second. • Ion yield changes with time as primary particles build up on the analyte effecting the ejection and path of secondary ions.
Dynamic SIMS generated depth Profile Depth profile of hydrogen embedded in Silicon. http://www.siu.edu/~cafs/surface/file6.html
Drawbacks • Depth analysis is limited by the embedding of primary ions into the sample. This can cause charge build up, which will especially distort the path of secondary ions of an electrical insulator. • Resolution of the analytes is decreased by the fact that the surface may wear down differently throughout the sample. • Stoichiometric and matrix properties of the analyte must be known to interpret the data. • Inconsistencies in sputter yield. • Inconsistencies in atomic ionization. • Sample is at least partially destroyed in the analysis process.
Figures of Merit • At low frequency ion bombardment the outer most 5 nm of a sample can be characterized. • Secondary ion images have resolution on the order of .5 to 5 μm. • Detection limits for trace elements range between 1012 to 1016 atoms/cc. • Detection limits are affected by stray ions and electrons in the vacuum instrument system and by cosmic rays. Their presence can create currents called dark currents, which can drown out a weak secondary ion signal. • Spatial resolution is determined by primary ion beam widths, which can be as small as 100 nm.
Variations • Sputtered Neutral Mass Spectrometry (SNMS) involves the depth analysis of samples by collecting neutral atoms and clusters followed by ionization and mass spectrometry. This technique’s elemental sensitivities are fairly independent of the matrix. and thus it can be used for quantification with greater accuracy over dynamic SIMS, although the DL is higher. • Time of Flight Secondary Ion Mass Spectroscopy involves pulsed particle beams.
Resources • Dr. Marx. Surfaces and Contact Mechanics http://www.siu.edu/~cafs/surface/file6.html • Arizona State Univeristy SIMS Labhttp://www.asu.edu/clas/csss/SIMS/ • Charles Evans & Associates. Secondary Ion Mass Spectrometry Theory Tutorial. http://www.cea.com/cai/simstheo/caistheo.htm • University of Arizona. Secondary Ion Mass Specrtoscopy. http://www.u.arizona.edu/~xiuminj/web/SIMSdefault.htm • Rubinson, KA and Rubinson JF. Contemporary Instrumental Analysis. Prentice-Hall, Inc., Upper Saddle River, New Jersey. 2000. Pp. 536-555. • Montana State University Dept of Physics. SIMS. http://www.physics.montana.edu/ical/Pages/sims.htm