Download
1 / 26
280 likes | 573 Vues
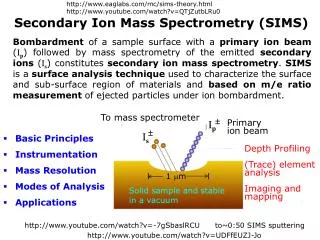
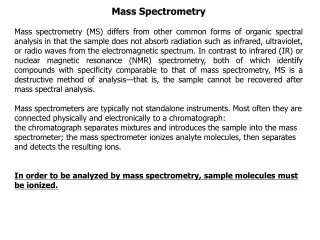
Fourier Transform Ion Cyclotron Resonance Mass Spectrometry. Christopher L. Hendrickson. Ion Cyclotron Resonance Program National High Magnetic Field Laboratory Department of Chemistry and Biochemistry Florida State University. June 22, 2009. m. r. M. What is Mass Spectrometry?.

E N D
Fourier Transform Ion Cyclotron Resonance Mass Spectrometry Christopher L. Hendrickson Ion Cyclotron Resonance Program National High Magnetic Field Laboratory Department of Chemistry and Biochemistry Florida State University June 22, 2009
m r M What is Mass Spectrometry? What is mass? Gravity F= GmM/r2 Newton’s second law F = ma Mass-Energy equivalence E = mc2 1 eV = ~10-9 amu Newton Einstein
B m m v v - + qv x B qv x B r r Ion Cyclotron Motion Marshall and Grosshans, Anal. Chem.1991, 63, 215A.
mv2 = q v B r mv = q B r q B m Magnetic Force Centripetal Force kinetic energy distance slit width m = q B = 2πf = Ion Cyclotron Resonance 100 ≤ m/z ≤3000 corresponds to 35 kHz ≤ f ≤ 1 MHz at 7 tesla
Ernest O. Lawrence 1939 Nobel Prize in Physics Donald Cooksey Cyclotron Accelerator
FT-ICR Trap Geometry E Y D B D E T T Z T T X E E D D D D T E T,E T T,E T D E,D,T E T E D
+ + + + + + + + + + + + R C + + + + + + Excitation Detection fast (~1 ms) scan all m/z simultaneously B0 Marshall et. al., Mass Spectrom. Rev.1998, 17, 1.
Bovine Ubiquitin Image Charge Differential Amplifier 0 FT 80 240 400 Time (ms) 10+ 9+ _ m q B f E f2 = 8+ 1071 1072 11+ 12+ 7+ 100 150 200 250 Frequency (kHz) 10+ 9+ 8+ 11+ 12+ 7+ 600 1000 1400 1800 m/z
f m = m f Resolving Power (RP) = At 7 Tesla, RP is greater than 100,000 at m/z 500 for a 1 s observation Magnitude-mode lineshape and Hanning apodization ~2 f50% observation period (s) Frequency (Hz)
m Low Resolving Power = 2500 Dm High Resolving Power m = 350,000 Dm 563.25 563.35 563.45 563.55 563.65 563.75 m/z
453 * 454 455 m = 3,300,000 Dm RVMRGMR vs. RSHRGHR (MW 904 Da) Monoisotopic Mass (S2H8 vs. N4O) 0.000452 0.000005 Da 2+ Charge State Isolated by SWIFT m(e-) = 0.000548 Da He et. al., Anal. Chem.2001, 73, 647-650(9.4 T) 300 500 700 906.496 906.499 906.502 m (Da) Smallest resolved mass difference between two molecules!
Middle East Crude Oil, (+) APPI at 14.5 T 3.4 mDa, C3 vs. SH4 4.5 mDa, 13C vs. CH 3.4 mDa 2.3 mDa 3.6 mDa, C1N1 vs. 13C2 2.3 mDa, C7 vs. S2H713C1 1.1 mDa, SH313C1 vs. C4 3.6 mDa 1.1 mDa 49,797 peaks >6 m/m50% = 800,000 (m/z 400) 505.276 505.298 1000.04 1000.05 400 600 800 1000 1200 1400 m/z
mv2 = q v B r mv = q B r q B m Magnetic Force Centripetal Force kinetic energy distance slit width m = q B = 2πf = Ion Cyclotron Resonance 100 ≤ m/z ≤3000 corresponds to 35 kHz ≤ f ≤ 1 MHz at 7 tesla
FT-ICR Trap Geometry E Y D B D E T T Z T T X E E D D D D T E T,E T T,E T D E,D,T E T E D
FT-ICR Mass Calibration mv2 = qvB – qEr r m2r m2 = qBr – qEr = qB– qE Centripetal Force Magnetic Force Electric Force m B E – = q 2 Ledford et. al., Anal. Chem.1984, 56, 2744-2748.
7 – m2 B E = 6 q 5 (Th Hz2 x 1013) m f2 q 4 3 2 1 0 FT-ICR Mass Calibration rms error = 251 ppb m/q = 300-800 n = 34 0 100000 200000 300000 400000 Frequency (Hz)
Superconducting Magnet (B field) Stability 1400 1200 Magnetic Field Drift (ppb) 1000 2 ppb/hour 800 600 400 200 0 0 100 200 300 400 500 600 Time (hours)
Electric Field Stability 80 30 ppm shift in E leads to 1 ppb mass shift! 7 T, m/z 500 60 Frequency Shift (Hz) 40 ~8 Hz/V 20 0 0 2 4 6 8 10 Trap Potential (V)
What is Molecular Mass? Mass: M = Σmene, me – mass of an element ne – number of atoms of this element in the molecule Isotope Mass Abundance Chemical mass 1H 1.00782510 99.9852% 1.00794 2H (D) 2.01410222 0.0148% 12C 12.0(0) 98.892% 12.011 13C 13.0033544 1.108% 14N 14.00307439 99.635% 14.00674 15N 15.0001077 0.365% 16O 15.99491502 99.759% 15.9994 17O 16.9991329 0.037% 18O 17.99916002 0.204% 31P 30.9737647 100% 30.9737647 32S 31.9720737 95.0% 32.066 33S 32.9714619 0.76% 34S 33.9678646 4.22% 36S 35.967090 0.014%
C17H21+ C16H33+ C16H17O+ Measured Theoretical C15H13S+ 225.07326225.07325 C15H13S+ C16H17O+ 225.12733225.12739 C17H21+ 225.16375225.16378 C16H33+ 225.25769225.25768 221 225 229 300 200 250 150 m/z Raw Diesel Fuel Marshall et. al., Mass Spectrom. Rev.1998, 17, 1.
0 1 -1 1500 (-) APPI FT-ICR MS Crude Oil 1250 12,449 Assigned Masses 1000 Number of Assigned Masses per Bin 750 400 ppb 500 50 ppb bins 250 0 Mass Error, ppm
C17H21+ C16H33+ C16H17O+ Measured Theoretical C15H13S+ 225.07326225.07325 C15H13S+ C16H17O+ 225.12733225.12739 C17H21+ 225.16375225.16378 C16H33+ 225.25769225.25768 221 225 229 300 200 250 150 m/z Raw Diesel Fuel Marshall et. al., Mass Spectrom. Rev.1998, 17, 1.
Molecular mass is the isotopic distribution! [M+10H]10+ Ubiquitin C378H629N105O118S1 857 858 m/z
c242+ c8 c5 z10 z11 z8 z5 c11 c10 z12 z4 z20 c6 z7 c20 z3 z6 z14 c21 z9 c14 c17 c15 z17 z19 c22 c4 z15 c7 c18 n2 F K G P G D T S N F D D Y E E E E I R V S I N E K ~ x 30 [M + HPO3 + 2H]2+ [M + HPO3 + 3H]3+ AI-ECD ECD 10 ms Delay 1 ms IRMPD 100 ms (8 W) (30 scans) 500 1000 2000 2500 m/z 1500
Advantages of High Magnetic Field Mass Resolving Power Acquisition Speed Mass Accuracy Dynamic Range Kinetic Energy* 21 T Peak Coalescence 21 T 14.5 T 12 T 9.4 T 14.5 T 7 T 12 T 9.4 T 7 T 0 25 0 25 B (tesla) B (tesla) Marshall and Guan, Rapid Commun. Mass Spectrom. 1996, 10, 1819-1823