Secondary Ion Mass Spectrometry
840 likes | 1.65k Vues
Secondary Ion Mass Spectrometry. Professor Paul K Chu. Secondary Ion Mass Spectrometry (SIMS). Sputtering by Elastic Collisions. Single knock-on < 1keV All secondary ions virtually originate from the uppermost atomic layers. Linear cascade 1 keV – 1 MeV sputtering yield proportional

Secondary Ion Mass Spectrometry
E N D
Presentation Transcript
Secondary Ion Mass Spectrometry Professor Paul K Chu
Sputtering by Elastic Collisions Single knock-on < 1keV All secondary ions virtually originate from the uppermost atomic layers Linear cascade 1 keV – 1 MeV sputtering yield proportional to beam energy Spike > 1 MeV High density of recoil atoms
Sputtering Events with Time (a) Sputtering event, T=0 Predicted trajectories (b) Sputtering event, T10-13 s Post trajectories - indicated (c) Sputtering event, T 10-10s
Simulated Trajectories Computer simulation: Displacement of Cu atoms due to the impact of 4 keV argon ions (a) Trajectories within the entire volume of collision cascade for 10 incident particles (b,c) Transport of target atoms out of and into the designated layer (20 incident particles) (d) Trajectories of sputtered atoms (50 incident particles)
Sputtering Yield Sputtering yield is the average number of sputtered particles per incident ion. • In the linear cascade regime, the sputtering yield is proportional to ion beam energy. • Sputtering yield depends on a) atomic number, b) Displacement energy, c) Matrix of solid. Ion sputtering yield is the average number of ions emitted per incident primary ion. • Many factors affect the ion yield. The most obvious are • Intrinsic tendency to be ionized • Positive ion : Ionization potential (IP) • Negative ion: Electron affinity (EA) • Matrix effects • Al+ from Al2O3 versus Al+ from Al metal • Secondary ion cluster spectrum from Ar ion bombardment of Al. Note that the ordinate is in a log scale. Predominant species are Al+ ions; Al2+ and Al3+ are also abundant
Matrix Effects DI = I - ICLEAN Absolute secondary ion yields as a function of atomic number, under high vacuum conditions (a) and under oxygen saturation (b): 3keV Ar , incident angle 60 , + o m beam density 10-3 A/cm , pressure 10 Torr -2 -10
Ion Yield Enhancement Enhancement by O- Enhancement by Cs+ Relative positive ion yield for 13.5 13.5 keV normal incident O-; -compound was used, B.D; Barely detectable Relative negative ion yield for 16.5 keV Cs+, normal incidence
Ion Yield versus Ionization Potential and Electron Affinity (a)Positive relative ion yield of various certified elements (M+/Fe+) in NBS 661 stainless steel reference material versus ionization potential (b) Negative relative ion yields of various certified elements (M-/Fe-) in NBS 661 stainless steel reference material versus electron affinity
Secondary Ion Yield The variability in ionization efficiency leads to different analysis conditions for elements as indicated on the periodic table.
Positive and Negative Ion Spectra GaAs Al alloy Positive ion spectrum Negative ion spectrum
Positive and Negative Ion Spectra Positive and negative spectra are complementary and useful in searching for traces of chemical elements and their complexes.
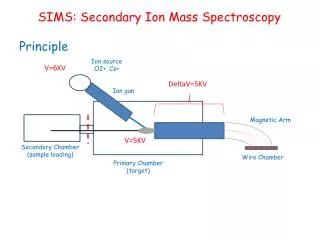
Instrumentation • Ion Sources • Ion sources with electron impact ionization - Duoplasmatron: Ar+, O2+, O- • Ion sources with surface ionization - Cs+ ion sources • Ion sources with field emission - Ga+ liquid metal ion sources • Mass Analyzers • Magnetic sector analyzer • Quadrupole mass analyzer • Time of flight analyzer • Ion Detectors • Faraday cup • Dynode electron multiplier
Cameca SIMS • Cs ion source • Duoplasmatron ion source • Primary beam mass filter • Immersion lens • Sample • Dynamic emittance matching • Transfer lens system • Liquid metal source • Entrance slit S1 • 90o electrostatic analyzer • Energy slit S2 • Intermediate lens 1 • 90o magnetic sector • Exit slit S3 • Projection lenses • Projection deflector • Channelplate • Fluorescence screen • Electron multiplier • Faraday cup
Magnetic Sector Analyzer High transmission efficiency High mass resolution Imaging Capability R 2000 Capable: R ~ 105
Ion Detectors Faraday Cup Secondary electron Multiplier 20 dynodes Current gain 107
Energy Distribution of Sputtered Particles Energy distribution of neutral particles of some elemental polycrystalline targets emitted in the direction of the surface normal: Ar+ ions, EP = 900 eV, incident angle = 0 O
Mass Resolution • Several definitions of mass resolution (R). • R - capability of a mass spectrometer to differentiate between masses. • M - mass difference between two adjacent peaks that are just resolved M - nominal mass of the first peak or mean mass of two peaks. • Resolution is also defined as the full width at half maximum (FWHM) of a peak. • C2H4+ 28.0313 • CH2N+ 28.0187 M = 0.0126 • N2+ 28.0061 • CO+ 27.9949
Common Mass Interferences • Interfering Analytical Required M ion ion resolution • 28Si+32S+ 960 0.0146 • Matrix16O2+32S+ 1800 0.0178 • ions Si2+56Fe+ 2960 0.0189 46Ti28Si+ 75As+ 10940 0.0069 46Ti29Si+ 75As+ 10500 0.0091 • Matrix+29Si30Si16O+75As+ 3190 0.0235 • primary • Hydrates30Si1H 31P+ 3950 0.0078 27Al1H- 28Si- 2300 0.0120 54Fe1H+ 55Mn+ 6290 0.0087 120Sn1H+ 121Sb+ 19250 0.0062 • Hydrocarbons12C2H3+27Al+ 640 0.0420 12C5H3+63Cu+ 670 0.0939
Quantitative Analysis Area of analysis Instrumental transmission factor for A+ Primary ion current density IA+T = jp A YA+T fA+T CA+T Measured secondary ion current of A+ in the matrix T Secondary ion yield in the matrix T Atomic concentration of A in the matrix T IA+T = SA+T CA+T SA+T Sensitivity factor for A in the matrix T Very difficult to calculate SA+T. It depends on the 1. Element and matrix 2. SIMS instrument 3. System parameters Standards are normally used Measure IA+T Use SA+T from standard Find CAT Measure IA+T From known CAT Find SA+T Sample Standard the same matrix
Inherent SIMS Sensitivity • Silicon with an atom density of 51022 Si atoms/cm3 • Bombarded area of (100 m)2 = (10-2 cm)2 = 10-4 cm2 • Sputtering rate of 1.0 nm/sec = 10-7 cm/sec • Then, silicon volume removed per second by sputtering is • V = 10-4 cm2 10-7 cm/sec = 5 10-11 cm3/sec • Hence, a number of the removed atoms per second by sputtering is • N = 5 1022 cm-3 10-11 cm-3/sec = 5 1011/sec • Assume • 1% Secondary ion yield • 10% Ion transmission • Then, ions detected • 5 1011/sec 10-3 ions = 5 108 ions/sec • If 5 ions/sec is a threshold, then • (5 ion/sec)/(5 108 ion/sec) = 10-8 = 10 10 ppb • The detection limit is 5 1014 atoms/cm3
Typical Detection Limits in Silicon • Primary Ion Beam O2+ or Cs+ Element Detection Limit • Element Detected Ion atom/cm3B 11B+ <1013 • P 31P-/31P+ <51014 • As 28Si75As - <1014 • Sb 121Sb+ <51013 • C 12C-<51015 • O 16O-<51016 • N SiN-<51015 • H H-<51017
Common Modes of Analysis • The bulk analysis mode is used to detect trace-level components, while sacrificing both depth and lateral resolution. • The mass scan mode is used to survey the entire mass spectrum within a certain volume of the specimen. • The depth profiling mode is use to measure the concentration of pre-selected elements as a function of depth from the surface. • The imaging mode is used to determine the lateral distribution of pre-selected elements. In certain circumstances, an imaging depth profile combining both depth profiling and imaging can be obtained.
Fingerprint of polymers Positive mass spectrum from polyethylene, 0 - 200 amu Positive mass spectrum from polystyrene, 0 - 200 amu
Sometimes both positive and negative spectra are needed Positive mass spectrum from polyphenylene sulfide, 0 – 200 ammu No indication of S It looks like polyethylene Negative mass spectrum from polyphenylene sulfide, 0 –250 amu
CRATER EFFECT The shape of the depth profile can be affected by a) Redeposition by sputtering from the crater wall onto the analysis area b) Direct sputtering from the crater wall
Crater Effect (a) (b) (a) Ions sputtered from a selected central area (using a physical aperture or electronic gating) of the crater are passed into the mass spectrometer. (b) The beam is usually swept over a large area of the sample and signal detected from the central portion of the sweep. This avoids crater edge effects. The analyzed area is usually required to be at least a factor of 3 3 smaller than the scanned area.
Requirements for High Precision SIMS Analysis • Stable Primary Ion Gun • Mass Analyzer with High Stability • Low Noise Electronics and Highly Stable Detector • Consistent Secondary Ion Extraction