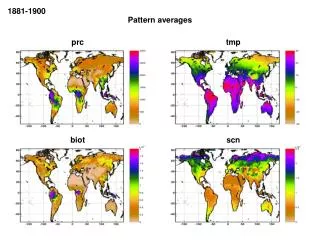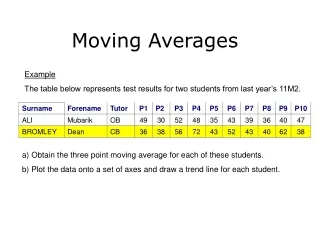
Averages
Averages. FTC. Area. Riemann Sums. Properties. Hodge Podge. Riemann Sums. Averages. Hodge Podge. FTC. Area. Properties. 10. 10. 10. 10. 10. 10. 20. 20. 20. 20. 20. 20. 30. 30. 30. 30. 30. 30. 40. 40. 40. 40. 40. 40. 50. 50. 50. 50. 50. 50. Category 1


Averages
E N D
Presentation Transcript
Riemann • Sums
Riemann • Sums • Averages • Hodge Podge • FTC Area • Properties • 10 • 10 • 10 • 10 • 10 • 10 • 20 • 20 • 20 • 20 • 20 • 20 • 30 • 30 • 30 • 30 • 30 • 30 • 40 • 40 • 40 • 40 • 40 • 40 • 50 • 50 • 50 • 50 • 50 • 50
Category 1 10 points
Category 1 20 points
Category 1 30 points
Category 1 40 points
Category 1 50 points
Category 2 10 points
Category 2 20 points
Category 2 30 points
Category 2 40 points
Category 2 50 points
Category 3 10 points
Category 3 20 points
Category 3 30 points
Category 3 40 points
Category 3 50 points
Category 4 10 points
Category 4 20 points
Category 4 30 points
Category 4 40 points
Category 4 50 points
Category 5 10 points
Category 5 20 points
Category 5 30 points
Category 5 40 points
Category 5 50 points
Category 6 10 points
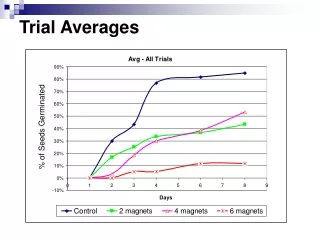
Category 6 20 points • A car starts at noon and travels with the velocity shown in the graph below. A truck starts at 1 pm from the same place and travels a constant velocity of 50 mph. • How far away is the car when the truck starts? • During the period when the car is ahead of the truck, when is the distance between them the greatest? • When does the truck overtake the car, and how far have they both traveled then?
Category 6 30 points
Category 6 40 points
Category 6 50 points