Download
1 / 5
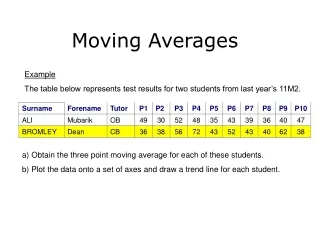
Moving Averages
50 likes | 182 Vues
Moving Averages. Why use them?. Moving Averages, when graphed, allow us to see any trends in data that are cyclical By calculating the average of 2 or more items in the data, any peaks and troughs are smoothed out. 265. 269.25. 265.25. 270.75. 4 Period Moving Average.
Télécharger la présentation 
Moving Averages
An Image/Link below is provided (as is) to download presentation
Download Policy: Content on the Website is provided to you AS IS for your information and personal use and may not be sold / licensed / shared on other websites without getting consent from its author.
Content is provided to you AS IS for your information and personal use only.
Download presentation by click this link.
While downloading, if for some reason you are not able to download a presentation, the publisher may have deleted the file from their server.
During download, if you can't get a presentation, the file might be deleted by the publisher.
E N D
Presentation Transcript
Why use them? • Moving Averages, when graphed, allow us to see any trends in data that are cyclical • By calculating the average of 2 or more items in the data, any peaks and troughs are smoothed out.
265 269.25 265.25 270.75 4 Period Moving Average
500 x 400 x x 300 x x x x x x x x x x x x x x x 200 x x x 100 1 4 2 3 1 4 2 3 1 4 2 3 1998 1996 1997


More Related