Google Earth
Google Earth: A New Display Tool for Hydrologic Data Sets. Google Earth. Brian Cosgrove NOAA/NWS/OHD. Outline. Project motivation and background Google Earth overview Strategies for importing XMRG/HRAP data into GE Conversion strategies for non-HRAP/XMRG data

Google Earth
E N D
Presentation Transcript
Google Earth: A New Display Tool for Hydrologic Data Sets Google Earth Brian Cosgrove NOAA/NWS/OHD
Outline • Project motivation and background • Google Earth overview • Strategies for importing XMRG/HRAP data into GE • Conversion strategies for non-HRAP/XMRG data • xmrgtokml conversion utility • Example GE images using xmrgtokml output • Additional GE hydrologic visualizations • Summary
Motivation • Modern computing and observation systems have created an explosion of hydrologic data sets • NOAA/OHD faces sizable visualization challenges • Distributed Hydrologic Model Threshold Frequency (DHM-TF) Flash Flood Modeling Approach • High resolution 4km XMRG output on HRAP grid • No intuitive, accessible means of visualizing data • Additional XMRG/HRAP hydrological modeling data sets • A clear need exists for accessible and accurate visualization of hydrologic observation and forecast data • Research Goal: Create a means of visualizing XMRG/HRAP data sets with potential applicability to other data projections
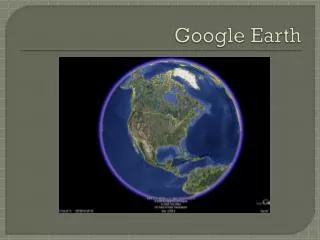
Visualizing Hydrologic Data AWIPS Google Earth NASA World Wind GrADS MATLAB NOAA/OHD data sets (XMRG file format, HRAP coordinate system) Best Visualization Strategy?
Google Earth Disadvantages • No data processing capability • Limited layer management • No control of title, color bar • Latitude Longitude projection with a WGS84 datum for its imagery base • HRAP data needs to be processed before ingest • Potential precision, accuracy and coordinate system mismatch between GE and data (being investigated) • Slow display of polygons • KML file format Advantages • Extremely intuitive, accessible, and free • Displays how data sets line up with real-world features (i.e., roads, buildings, rivers, vegetation, mountains) • Aerial and street-level views • Time lapse images • User-drawn place marks and polygons • Availability of KML data • Web-linked datasets • Automatic updates
Google Earth Google Earth Screenshot http://www.nites.noaa.gov/bpa/display.asp?bpaID=14 EXAMPLE KML <?xml version="1.0“ encoding="UTF-8"?> <kml xmlns="http://earth.google.com/kml/2.2"> <Placemark> <name>Stonehenge, England</name> <description>Stonehenge Point </description> <Point> <coordinates>-1.8267,51.1790 </coordinates> </Point> </Placemark> </kml> • NOAA has an enterprise license agreement for unlimited use of GE Pro • GE data files need to be in Keyhole Markup Language (KML) format, and can be zipped into KMZ format • KML: A tag-based language like HTML • Specify icons and labels, image overlays • Create different camera positions • Write HTML descriptions with hyperlinks and embedded images • Dynamically update remote KML files
Google Earth U.S. Capitol Building Model-based Flash Flood Return Periods Herd of African Elephants Challenge: Use a program often associated with aerial views of landmarks and nature to make detailed hydrologic data accessible to end users
Strategies for Importing XMRG/HRAP data into Google Earth • Question: How to display XMRG formatted HRAP data sets in Google Earth? • Approach: Convert data to KML format with a Latitude Longitude projection • Two possible methods • Convert each HRAP pixel into a clickable HRAP polygon for display in GE • Interpolate HRAP data to lat/lon, create image file, overlay image in GE
Clickable Polygon Method 40,-98 40,-98 40,-97 40,-97 39,-97 39,-97 39,-98 39,-98 Repeat for all HRAP cells Produce title and color bar 16.5 *Calculate Lat/Lon of HRAP cell corners Draw polygon in KML and assign value and color View KML in Google Earth Original data on HRAP grid Accurately reproduces value of HRAP pixel Very small error in straight line HRAP pixel outline Clickable to display HRAP coordinates and data value KML file size can be prohibitively large for areas bigger than an RFC domain *Reverse of the code used in the NEXRAD software that takes data from the radar processing system and projects it into HRAP
Interpolated Image File Method Interpolation and Lat/Lon bound specification with GrADS Produce title and color bar Graphical image on Lat/Lon grid Image overlay in Google Earth Original data on HRAP grid • File size is much smaller than polygon method • Shaded or contour line styles can be selected • Flexibility in spatial resolution of interpolated data • Interpolated data values differ from original HRAP pixels • Areas along domain boundaries may be clipped • Individual pixels cannot be queried
Strategies for Importing XMRG/HRAP data into Google Earth • Techniques developed explicitly to address display of NOAA/OHD XMRG/HRAP flash flood data • Can also display other HRAP data sets • General conversion techniques can be adapted for display of other data projections • Clickable Polygon Method • Requires method of computing Lat/Lon of pixel corner points • Interpolated Image Method • Requires that GrADS be able to convert between projections • Alternatively, any program can be used that converts between projections and determine Lat/Lon bounds needed for KML
Importing XMRG data into GE: xmrgtokml • Program produces KML file needed by Google Earth to display XMRG/HRAP data (clickable polygon or image interpolation) • xmrgtokml ingests XMRG header information describing HRAP grid • Functions with various HRAP resolutions (1, 0.5, 0.25 HRAP) • Errors in XMRG header can lead to display errors • Program has several requirements • xmrgtoasc and a2png conversion utilities, luxisr.ttf font, Linux zip utility • User is able to specify several options, including subset bounds, contour levels, a customized title, pixel outlines, and other options • Limitations • xmrgtokml is in early Alpha development stage • Feedback will be essential for bug repairs and capability enhancements • As previously noted, issues with datum compatibility, accuracy, precision are being investigated
Notice: xmrgtokml requires xmrgtoasc utility, luxisr.ttf, zip utility, convert utility, and a2png program Enter input HRAP filename to be converted to KML format tair1231200618z Enter base output file name (will be applied to KML, legend, and title files) tair1231200618z Enter title for plot (leave blank for no title) DMIP2 Air Temperature Enter min and then max values on separate lines or leave blank for automatic range 30 50 Enter min hrapx, max hrapx, min hrapy, and max hrapy on separate lines or leave blank for full domain plot Enter Plot Style: 1 for flat polygons, 2 for extruded polygons, 3 for shaded image file, 4 for contour image file (Extruded often looks best, but flat should be used if terrain is turned on in Google Earth. Image files are best for large domains) 2 Draw pixel outlines? 1-Yes 0-No 1 Display non-positive values? 1-Yes 0-No 1 ----------------------------------------- ncols nrows,xll,yll,nodata,cellsize 48 39 61 429 -1.000000 1.000000 ----------------------------------------- min,max,increment 30.00000 50.00000 2.500000 ----------------------------------------- level 2 = 30.00000 level 3 = 32.50000 level 4 = 35.00000 level 5 = 37.50000 level 6 = 40.00000 level 7 = 42.50000 level 8 = 45.00000 level 9 = 47.50000 level 10 = 50.00000 ----------------------------------------- hrapx,hrapy,xsize,ysize,x,y 61.00000 429.0000 48 39 -340.0000 -1172.000 ----------------------------------------- wrote tair1231200618z.nointerp.kmz wrote tair1231200618z.legend.png wrote tair1231200618z.title.png xmrgtokml screen dialog Soon to be available upon request
Importing Shapefiles into Google Earth • Google Earth Pro can automatically convert and display ESRI Shapefiles • Most files are converted without trouble • HRAP projection Shapefiles require special .prj file Contents of .prj file needed for displaying HRAP Shapefiles PROJCS["Stereographic",GEOGCS["Unknown",DATUM["D_unknown",SPHEROID["Unknown",6371200,"inf"]],PRIMEM["Greenwich",0], UNIT["Degree",0.017453292519943295]],PROJECTION["Polar_Stereographic"],PARAMETER["latitude_of_origin",60], PARAMETER["central_meridian",-105], PARAMETER["scale_factor",1], PARAMETER["false_easting",401], PARAMETER["false_northing",1601],UNIT["meters",4762.5]]
Clickable Polygon Versus Interpolated Image Method-XMRG/HRAP DMIP2 Temperature- Clickable Polygon Interpolated Image (Contour and Shaded)
Clickable Polygon Versus Interpolated Image Method Clickable Polygons Interpolated Image (Shaded) Interpolated Image (Shaded) • Sacramento XMRG/HRAP Lower Zone Tension Water Maximum (LZTWM) parameter
Google Earth Viewing Perspectives • Opaque/semi-transparent Sacramento LZTWM overlay with no pixel outlines • Google Earth default base map • Bird’s eye as well as tilted perspective view
MPE Precipitation (mm) 23Z April 21st to 00Z April 22nd 2009 HPE Precipitation (mm) 23Z April 21st to 00Z April 22nd 2009 Observations 1-2 Hour HPN Forecast (mm) 23Z April 21st to 00Z April 22nd 2009 0-1 Hour HPN Forecast (mm) 23Z April 21st to 00Z April 22nd 2009 Forecasts • MPE, HPE, and HPN precipitation data (XMRG format and HRAP coordinate system) displayed with clickable polygon method • Google terrain background
XMRG Data: Regional (1/4 HRAP) Precipitation • Opaque precipitation overlay with no pixel outlines • Google Terrain base map • User-specified min/max contour intervals
XMRG/HRAP HPN and HPE Precipitation Data HPN 2-Hour Forecast Loop (mm) – 1 HRAP HPE Precipitation (mm) – ¼ HRAP Resolution • Opaque precipitation overlay with no pixel outlines • Google Terrain base map • PowerPoint image loop
Beyond xmrgtokml: Utilizing Google Earth’s Capabilities to Visualize Additional Hydrologic Data Sets
Combining HRAP Data with GIS Shapefiles • DMIP2 temperature forcing data • Carson and American River basin outlines from DMIP2 shape file • Semi-transparent temperature overlay with pixel outlines drawn • Clickable temperature map • Google Terrain base map
Combining HRAP Data with GIS Shapefiles • Opaque (left) /semi-transparent (right) HRAP precipitation overlay with no pixel outlines • WFO boundary overlay from shapefile (in white, left) • Google Earth default base map • Clickable precipitation data
Combining HRAP Data with GIS Shapefiles • Opaque DMIP2 precipitation overlay with no pixel outlines • SNOTEL station locations from point-type shape file • Google Earth default base map
Combining HRAP Data with Warning and Verification Data—Tropical Storm Hanna Maximum return period values from MPE-driven DHM-TF simulated during the period of time from 16Z on September 6th through 02Z on September 7th 2008. Spotter-confirmed flash flood events are indicated by the Blue wave symbols Depiction of the areas covered by the three Tropical Storm Hanna flash flood warnings (outlined in Red) issued by the Sterling WFO that lie within the Maryland DHM-TF case study domain. Figure also depicts maximum return period values from DHM-TF covering a similar time period.
ESRI Shapefile: HRAP RFC Boundaries • RFC basin shapes from HRAP shapefile • Google Earth default base map
April 2nd, 2009: Red River Floods ( on map) Integrating multiple sources of data with Google Earth MODIS 19:30Z Visible Image (White=snow) SNODAS 06Z Model SWE • Georeferenced aerial photo • MODIS and SNODAS image overlays • Wild Rice River basin shapefile outline NOAA NOHRSC
Using Google Earth to View USGS Gauge Data • USGS gauge locations from KML file • Clickable map is linked to USGS database • Google Terrain base map
Gauge Site Survey • USGS gauge locations from KML file • HRAP grid (Black) and Sacramento HRAP river network (White) from KML file • Google Earth default base map • Useful in routing parameter derivation
Gauge Site Survey Upstream Downstream
Impact of terrain On/Off Image from alternate date On the morning of Wednesday, July 5, 2007 a flash flood rushed through Aliquippa's historical business district. The rainwater overwhelmed a culverted creek under Franklin Avenue, damaging over 500 buildings with water and mud in its wake.
Summary • A clear need exists for accessible and accurate visualization of hydrologic observation and forecast data • xmrgtokml utility developed to display NOAA/OHD DHM-TF and other HRAP data in Google Earth • Techniques presented are general enough to be adapted for use with non-HRAP data sets • Software is in Alpha stage, will be available in near future • Multiple issues remain to be addressed • Coordinate system, precision, and accuracy issues • Compatibility with other NOAA GIS resources • Ongoing bug fixes