Download
1 / 25
250 likes | 255 Vues
This figure analysis evaluates different strategies for health insurance reform and assesses their impact on the current system. The figure examines employer-provided health insurance, uninsured children, uninsured nonelderly adults, high out-of-pocket costs, access problems, receipt of recommended services, and insurance-related management of chronic conditions.

E N D
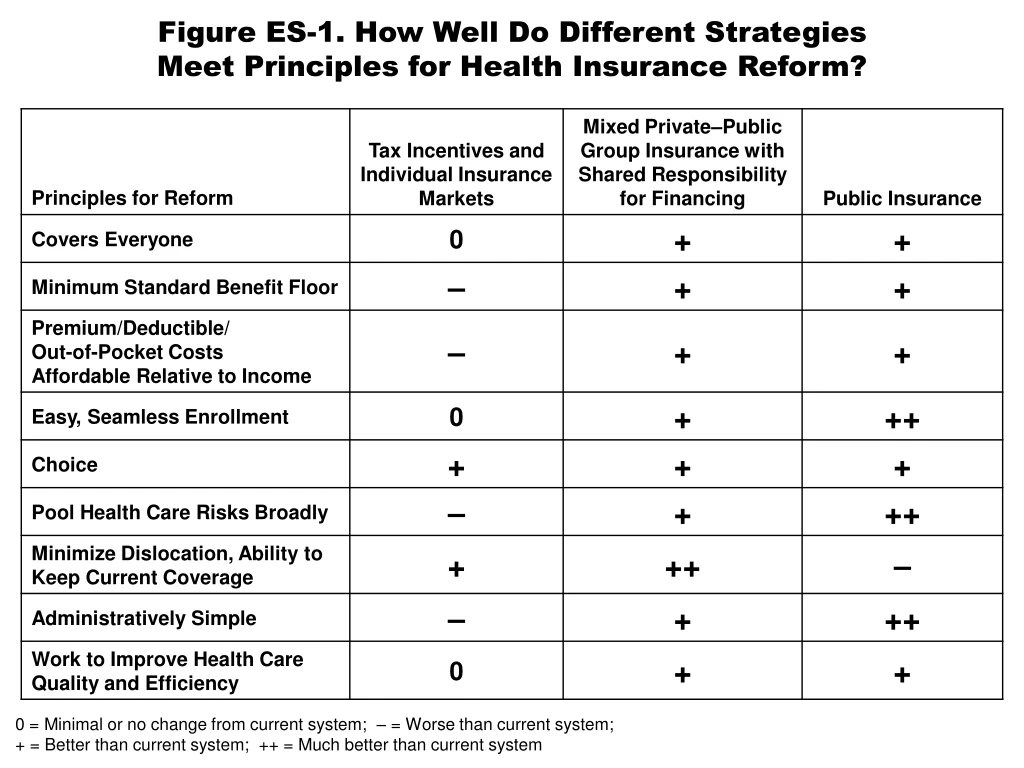
Figure ES-1. How Well Do Different StrategiesMeet Principles for Health Insurance Reform? 0 = Minimal or no change from current system; – = Worse than current system;+ = Better than current system; ++ = Much better than current system
Figure 2. Employer-Provided Health Insurance,by Income Quintile, 2000–2006 Percent of population under age 65 with health benefits from employer Source: Analysis of the March Current Population Survey, 2001–07, by Elise Gould, Economic Policy Institute.
1999–2000 2005–2006 NH ME WA NH VT ME WA VT ND MT ND MT MN MN OR NY MA WI OR MA NY ID SD WI RI MI ID SD RI WY MI CT PA WY NJ CT IA PA NJ NE IA OH DE IN NE OH NV DE IN IL MD NV WV UT VA IL MD CO DC WV UT VA KS MO KY CA CO DC KS MO KY CA NC NC TN TN OK SC AR OK AZ NM SC AR AZ NM MS GA AL MS GA AL TX LA TX LA FL FL AK AK 16% or more HI HI 10%–15.9% 7%–9.9% Less than 7% Figure 3. Percentage of Uninsured Children Has DeclinedSince Implementation of SCHIP, but Gaps Remain U.S. Average: 11.3% U.S. Average: 12.0% Source: J. C. Cantor, C. Schoen, D. Belloff, S. K. H. How, and D. McCarthy, Aiming Higher: Results from a State Scorecardon Health System Performance (New York: The Commonwealth Fund, June 2007). Updated Data: Two-year averages1999–2000, updated with 2007 CPS correction, and 2005–2006 from the Census Bureau’s March 2000, 2001 and 2006, 2007 Current Population Surveys.
1999–2000 2005–2006 NH NH ME WA NH VT ME WA VT ND MT ND MT MN MN OR NY MA WI OR MA NY ID SD WI RI MI ID SD RI WY MI CT PA WY NJ CT IA PA NJ NE IA OH DE IN NE OH NV DE IN IL MD NV WV UT VA IL MD CO DC WV UT VA KS MO KY CA CO DC KS MO KY CA NC NC TN TN OK SC AR OK AZ NM SC AR AZ NM MS GA AL MS GA AL TX LA TX LA FL FL AK AK 23% or more HI HI 19%–22.9% 14%–18.9% Less than 14% Figure 4. Uninsured Nonelderly Adult Rate Has Increasedfrom 17.3 Percent to 20.0 Percent in Last Five Years Source: J. C. Cantor, C. Schoen, D. Belloff, S. K. H. How, and D. McCarthy, Aiming Higher: Results from a State Scorecardon Health System Performance (New York: The Commonwealth Fund, June 2007). Updated Data: Two-year averages1999–2000, updated with 2007 CPS correction, and 2005–2006 from the Census Bureau’s March 2000, 2001 and 2006, 2007 Current Population Surveys.
Figure 5. Prevalence of High Family Out-of-PocketCost Burdens by Poverty Status Among theNonelderly Population, 1996 and 2003 Percent of nonelderly adults who spend >10% of disposable household income on out-of-pocket premiums and expenditures on health care services Source: J. S. Banthin and D. M. Bernard, “Changes in Financial Burdens for Health Care: National Estimates for the Population Younger Than 65 Years, 1996 to 2003,” Journal of the American Medical Association, Dec. 13, 2006 296(22):2712–19.
Figure 6. Access Problems Because of Costs in Five Countries, Total and by Income, 2004 Percent of adults who had any of three access problems* in past year because of costs * Did not get medical care because of cost of doctor’s visit, skipped medical test, treatment,or follow-up because of cost, or did not fill Rx or skipped doses because of cost. UK=United Kingdom; CAN=Canada; AUS=Australia; NZ=New Zealand; US=United States. Data: 2004 Commonwealth Fund International Health Policy Survey of Adults’ Experiences with Primary Care (Schoen et al. 2004; Huynh et al. 2006). Source: Commonwealth Fund National Scorecard on U.S. Health System Performance, 2006.
Figure 7. Receipt of All Three Recommended Servicesfor Diabetics, by Race/Ethnicity, Family Income,Insurance, and Residence, 2002 Percent of diabetics (ages 18+) who received HbA1c test, retinal exam, and foot exam in past year * ** * Insurance for people ages 18–64. ** Urban refers to metropolitan area >1 million inhabitants; Rural refers to noncore area <10,000 inhabitants. Data: 2002 Medical Expenditure Panel Survey (AHRQ 2005a). Source: Commonwealth Fund National Scorecard on U.S. Health System Performance, 2006.
Figure 8. Adults Without Insurance Are Less Likelyto Be Able to Manage Chronic Conditions Percent of adults ages 19–64 with at least one chronic condition* * Hypertension, high blood pressure, or stroke; heart attack or heart disease; diabetes; asthma, emphysema, or lung disease. Source: S. R. Collins, K. Davis, M. M. Doty, J. L. Kriss, and A. L. Holmgren, Gaps in Health Insurance: An All-American Problem, Findings from the Commonwealth Fund Biennial Health Insurance Survey (New York: The Commonwealth Fund, Apr. 2006).
Figure 9. Receipt of Recommended Screening and Preventive Care for Adults, by Family Income and Insurance Status, 2002 Percent of adults (ages 18+) who received all recommended screening and preventive care within a specific time frame given their age and sex* * Recommended care includes seven key screening and preventive services: blood pressure, cholesterol, Pap, mammogram, fecal occult blood test or sigmoidoscopy/colonoscopy, and flu shot. Data: B. Mahato, Columbia University analysis of 2002 Medical Expenditure Panel Survey. Source: Commonwealth Fund National Scorecard on U.S. Health System Performance, 2006.
Figure 10. Preventive Care Visits for Children,by Top and Bottom States, Race/Ethnicity,Family Income, and Insurance, 2003 Percent of children (ages <18)received BOTH a medical and dental preventive care visit in past year Data: 2003 National Survey of Children’s Health (HRSA 2005; retrieved from Data Resource Center for Child and Adolescent Health database at http://www.nschdata.org). Source: Commonwealth Fund National Scorecard on U.S. Health System Performance, 2006.
Figure 11. Children with a Medical Home, by Top and Bottom States, Race/Ethnicity, Family Income, and Insurance, 2003 Percent of children who have a personal doctor or nurse and receive care that is accessible, comprehensive, culturally sensitive, and coordinated* * Child had 1+ preventive visit in past year; access to specialty care; personal doctor/nurse who usually/always spent enough time and communicated clearly, provided telephone advice or urgent care and followed up after the child’s specialty care visits. Data: 2003 National Survey of Children’s Health (HRSA 2005; retrieved from Data Resource Center for Child and Adolescent Health database at http://www.nschdata.org). Source: Commonwealth Fund National Scorecard on U.S. Health System Performance, 2006.
Figure 13. People with Capped Drug Benefits HaveLower Drug Utilization, Worse Control of Chronic Conditions Percent of Drug Nonadherence Percent of Poor Physiological Outcomes Rate* of Medical Services Use * Rate per 100 person-years. Source: J. Hsu, M. Price, J. Huang et al., “Unintended Consequences of Caps on Medicare Drug Benefits,”New England Journal of Medicine, June 1, 2006 354(22):2349–59.
Figure 14. Cost-Sharing Reduces Use of Both Essential and Less Essential Drugs and Increases Risk of Adverse Events Percent reduction in drugs per day Percent increase in incidence per 10,000 Source: R. Tamblyn, R. Laprise, J. A. Hanley et al., “Adverse Events Associated with Prescription Drug Cost-SharingAmong Poor and Elderly Persons,” Journal of the American Medical Association, Jan. 24/31, 2001 285(4):421–29.
Figure 15. Many Americans Have ProblemsPaying Medical Bills or Are Paying Off Medical Debt Percent of adults ages 19–64 who had the following problems in past year: * Includes only those who had a bill sent to a collection agency when they were unable to pay it. Source: S. R. Collins, K. Davis, M. M. Doty, J. L. Kriss, and A. L. Holmgren, Gaps in Health Insurance: An All-American Problem, Findings from the Commonwealth Fund Biennial Health Insurance Survey (New York: The Commonwealth Fund, Apr. 2006).
Figure 16. One-Quarter of Adults with Medical Bill Burdensand Debt Were Unable to Pay for Basic Necessities Percent of adults ages 19–64 with medical bill problemsor accrued medical debt Source: S. R. Collins, K. Davis, M. M. Doty, J. L. Kriss, and A. L. Holmgren, Gaps in Health Insurance: An All-American Problem, Findings from the Commonwealth Fund Biennial Health Insurance Survey (New York: The Commonwealth Fund, Apr. 2006).
Figure 17. Increased Health Care CostsAssociated with Reduced Savings Has increased spending on health care expenses in the past year caused you to do any of the following? Among those with health insurance coverage who had increases in health care costs in the last year (percentage saying “yes”) Decrease your contributions to other savings Have difficulty paying for other bills Use up all or most of your savings Decrease your contributions to a retirement plan, such as a 401(k), 403(b), or 457 plan, or an IRA Have difficulty paying for basic necessities, like food, heat, and housing Borrow money Source: EBRI Health Confidence Survey, 2005 and 2006.
Figure 18. International Comparison of Spending on Health, 1980–2005 Average spending on healthper capita ($US PPP) Total expenditures on healthas percent of GDP Source: Commonwealth Fund National Scorecard on U.S. Health System Performance, 2006.Updated data from OECD Health Data 2007.
Figure 19. Americans Spend More Out-of-Pocketon Health Care Expenses Total health care spending per capita United States France Canada a Germany b Australia Netherlands OECD Median a Japan New Zealand Out-of-pocket spending per capita a2003 b2003 Total Health Care Spending, 2002 OOP Spending Source: The Commonwealth Fund, calculated from OECD Health Data 2006.
Figure 20. Increases in Health Insurance PremiumsCompared with Other Indicators, 1988–2007 Percent * Estimate is statistically different from the previous year shown at p<0.05. ^ Estimate is statistically different from the previous year shown at p<0.1. Note: Data on premium increases reflect the cost of health insurance premiums for a family of four. Historical estimates of workers’ earnings have been updated to reflect new industry classifications (NAICS). Source: G. Claxton, J. Gabel et al., "Health Benefits in 2007: Premium Increases Fall to an Eight-Year Low, While Offer Rates and Enrollment Remain Stable," Health Affairs, Sept./Oct. 2007 26(5):1407–16. Kaiser/HRET Survey of Employer-Sponsored Health Benefits, 2007, and Commonwealth Fund analysis of National Health Expenditures data.
Figure 21. Health Expenditure Growth 2000–2005for Selected Categories of Expenditures Average annual percent growth in health expenditures, 2000–2005 Source: A. Catlin, C. Cowan, S. Heffler et al., “National Health Spending in 2005: The Slowdown Continues,”Health Affairs, Jan./Feb. 2007 26(1):142–53.
Figure 22. Percentage of National Health ExpendituresSpent on Health Administration and Insurance, 2003 Net costs of health administration and health insuranceas percent of national health expenditures a b c * a2002 b1999 c2001 *Includes claims administration, underwriting, marketing, profits, and other administrative costs;based on premiums minus claims expenses for private insurance. Data: OECD Health Data 2005. Source: Commonwealth Fund National Scorecard on U.S. Health System Performance, 2006.
Figure 23. Employers Provide Health Benefits to More than160 Million Working Americans and Family Members Numbers in millions, 2006 Uninsured 47.0 (16%) Uninsured 46.4 (18%) Employer 163.3 (55%) Military 3.4 (1%) Employer 160.8 (62%) Military 3.4 (1%) Individual 16.0 (5%) Individual 15.8 (6%) Medicaid 27.9 (9%) Medicaid 27.9 (11%) Medicare 39.1 (13%) Medicare 6.4 (2%) Total population = 296.7 Under-65 population = 260.7 Source: Current Population Survey, March 2007.
Figure 24. How Well Do Different StrategiesMeet Principles for Health Insurance Reform? 0 = Minimal or no change from current system; – = Worse than current system;+ = Better than current system; ++ = Much better than current system